Research Breakthrough Possible @S-Logix
Office Address
- 2nd Floor, #7a, High School Road, Secretariat Colony Ambattur, Chennai-600053 (Landmark: SRM School) Tamil Nadu, India
- pro@slogix.in
- +91-81240 01111
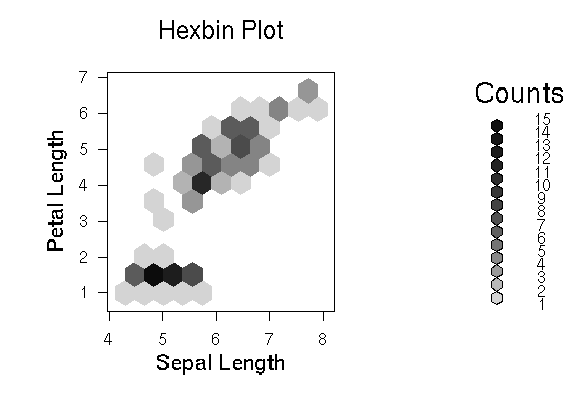
To create a hexbin plot using R programming.
Hexpin plot is a bivariate histogram.
R Package : hexbin
R Function : hexbin(x, y, xbins=, xlab= , ylab= , main= )
x , y : bivariate vectors
xbins : number of bins partitioning the range of x
xlab : Label for x
xlab : Label for y
Main : title of the graph
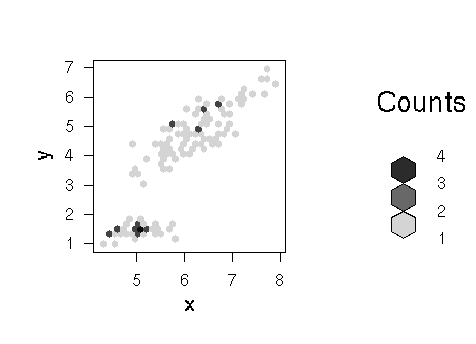
#hexbin plot
input<-hexbin(y~x)
plot(input)
#Adding xbins
input_1<-hexbin(y~x,xbins=10)
plot(input_1)
#Adding Labels
plot(input_1,xlab=”Sepal Length”, ylab=”Petal Length”,main=”Hexbin Plot”)