Research Breakthrough Possible @S-Logix
Office Address
- 2nd Floor, #7a, High School Road, Secretariat Colony Ambattur, Chennai-600053 (Landmark: SRM School) Tamil Nadu, India
- pro@slogix.in
- +91-81240 01111
To implement the ggplotly function using plotly package in R programming.
R Package : plotly
R Function :ggplot(x= , aes())
R Function :geom_bar()
R Function :ggtitle()
x -- Data Set
aes - Aesthetic mappings describe
how variables in the data are mapped to visual properties (aesthetics) of geoms.
Aesthetic mappings can be set in ggplot2() and in individual layers.
#Plotly Chart
#Loading required Packages
#install.packages(“plotly”)
library(“plotly”)
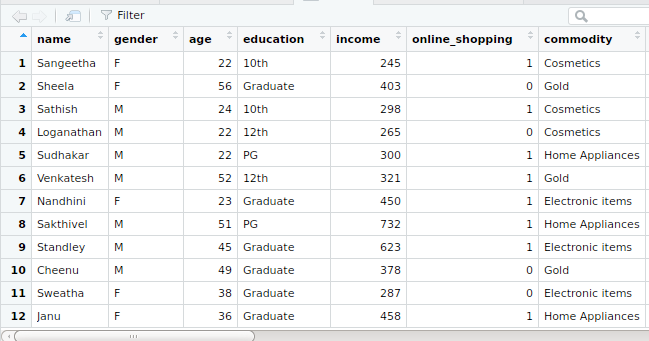
#Input Data Frame
input<-read.xlsx(“OnlineShopping”,sheetIndex = 1)
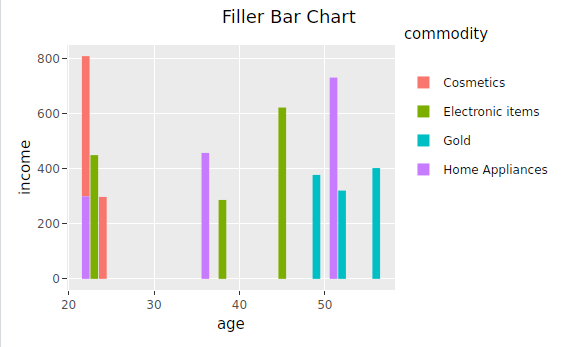
#ggploytly for Bar Chart
g<-ggplot(input,aes(age,income)) + geom_bar(aes(fill=commodity), stat = “identity”) + ggtitle(“Filler Bar Chart”)
ggplotly(g)
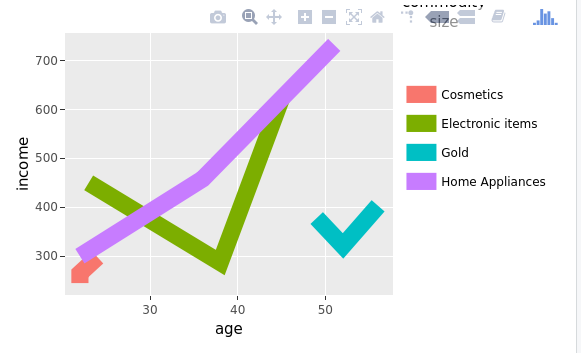
#ggplotly for grouped line Chart
g<-ggplot(input, aes(x=age, y = income)) + geom_line(aes(group = commodity, color = commodity,size=1))
ggplotly(g)