To implement the normal distribution using R programming.
dnorm(x, mean= sd= )
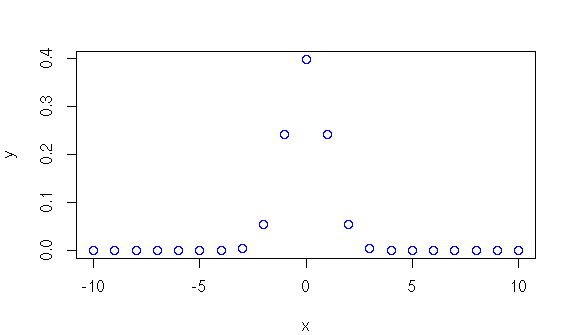
Gives height of the probability distributionat each point for a given mean andstandard deviation.
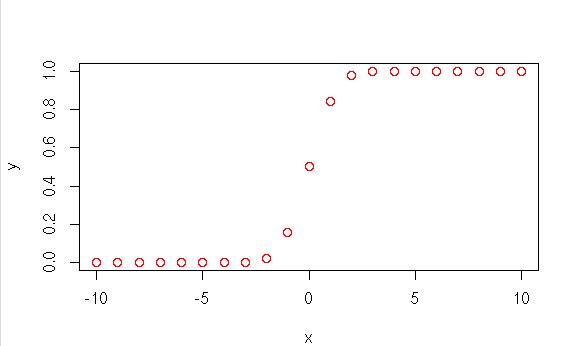
pnorm(x, mean= sd= ) Gives the probabi lity of a normally distributed random number to be less that the value of a given number. qnorm(p, mean= sd= )
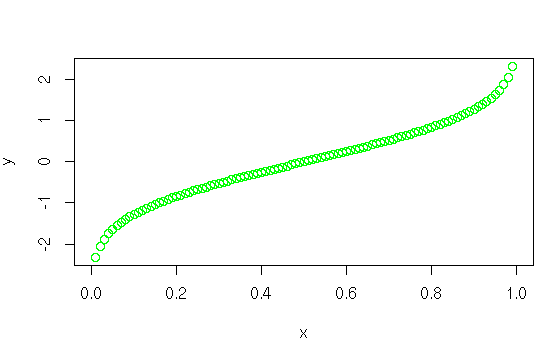
It takes the probability value and givesa number whose cumulative value matchesthe probability value. rnorm(n, mean= sd= )
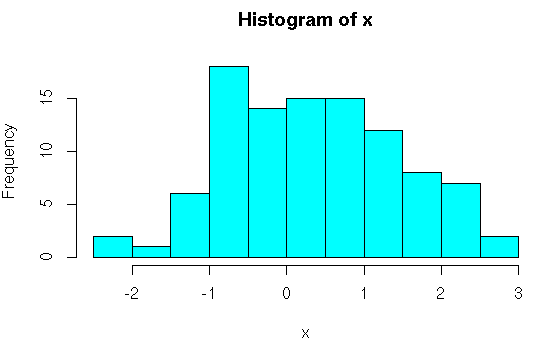
Used to generate random numberswhose distribution is normal.
x -- vector
mean -- Mean value of the sample data.
It's default value is zero.
prob -- The standard deviation. It's default value is 1.
#Normal Distribution
#dnorm
x<-seq(-10,10,by = 1)
y<-dnorm(x,mean=0,sd=1)
plot(x,y,col=”blue”)
#pnorm
y<-pnorm(x,mean=0,sd=1)
plot(x,y,col=”red”)
#qnorm
x<-seq(0,1,by=0.01)
y<-qnorm(x,mean=0,sd=1)
plot(x,y,col=”green”)
#rnorm
x<-rnorm(100)
hist(x,col=285)


