Amazing technological breakthrough possible @S-Logix pro@slogix.in

Office Address

  • #5, First Floor, 4th Street Dr. Subbarayan Nagar Kodambakkam, Chennai-600 024 Landmark : Samiyar Madam
  • pro@slogix.in
  • +91- 81240 01111

Social List

How to measure the Skewness and Kurtosis of the given data in R?

Description

To measure the Skewness and Kurtosis of the given data using R programming.

Process

Skewness:

  • Skewness is the measure of the symmetry.
  • Skewness is zero for a symmetrical data set(LHS=RHS).
  • R package : moments
  • R Function : skewness(x)
  • x– Data Frame

Kurtosis:

  • Kurtosis is a measure of whether the data are heavy-tailed or light-tailed relative to a normal distribution
  • A positive value tells you that you have heavy-tails (i.e. a lot of data in your tails).
  • A negative value means that you have light-tails (i.e. little data in your tails).
  • R package : moments
  • R Function : kurtosis(x)
  • x–Data Frame
Sapmle Code

#Measure of Skewness and Kurtosis

#Read File
print(getwd())
setwd(“/home/soft13”)
print(getwd())
data<-read.csv(‘input.csv’)
print(data)

#Skewness
#install.packages(“moments”)
library(“moments”)
skewness(data$salary)

#Kurtosis
kurtosis(data$salary)
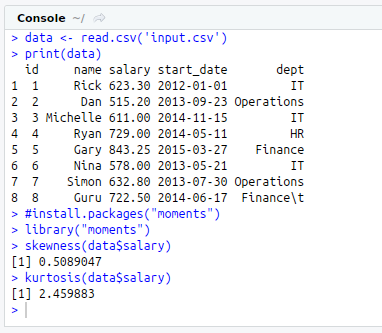
Screenshots
measure the Skewness and Kurtosis of the given data in R