Research Breakthrough Possible @S-Logix
Office Address
- 2nd Floor, #7a, High School Road, Secretariat Colony Ambattur, Chennai-600053 (Landmark: SRM School) Tamil Nadu, India
- pro@slogix.in
- +91-81240 01111
To visualize the correlation matrix using correlogram using R programming.
#Visualize Correlation Matrix using Correlogram
#Get and Set Working Directory
print(getwd())
setwd(“/home/soft13”)
getwd()
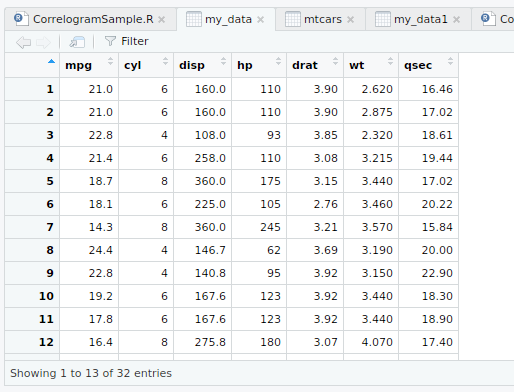
#Read file from Excel
#install.packages(“xlsx”)
library(“xlsx”)
my_data<-read.xlsx(“mtcars.xlsx”,sheetIndex=1)[,c(“mpg”,”cyl”,”disp”,”hp”,”drat”,”wt”,”qsec”)]
View(my_data)
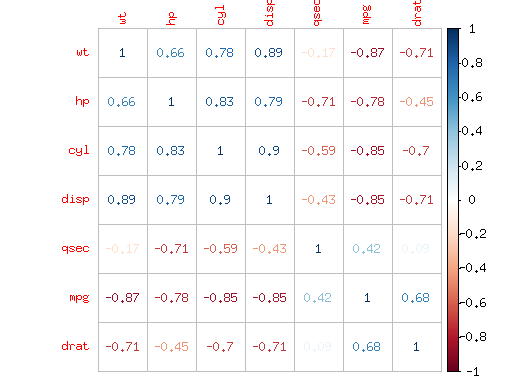
#Compute Correlation Matrix
input<-cor(my_data)
print(input)
#Visualization
library(“corrplot”)
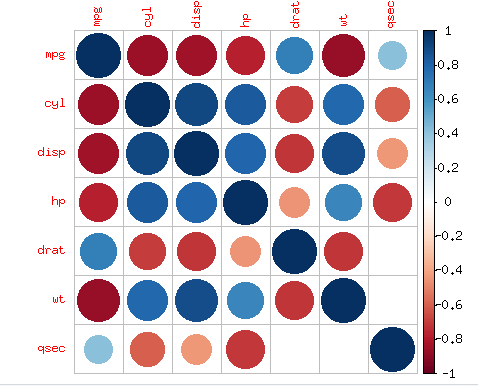
#Using Circle method
corrplot(input,method = “circle”, type = “upper”)
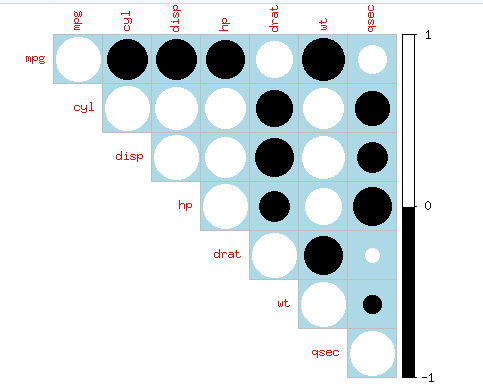
#Adding Colour and Background Colour To the Circle method
corrplot(input,method = “circle”, type = “upper”, col= c(“black”,”white”),bg=”lightblue”)
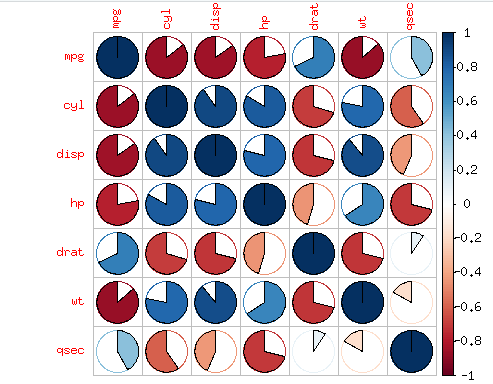
#Using Pie method
corrplot(input, method = “pie”)
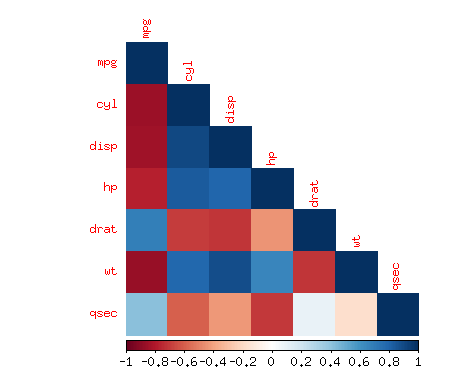
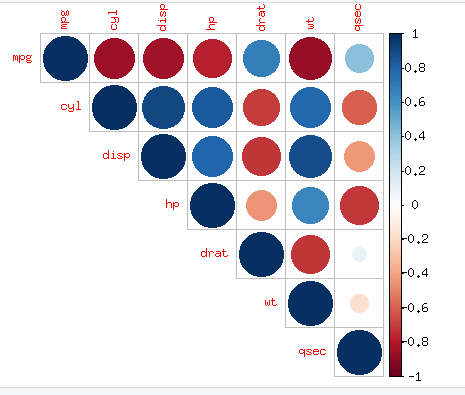
#Using Color Method
corrplot(input, method = “color”, type = “lower”)
#Using Number method
corrplot(input, method = “number”, type = “full”, order=”hclust”)
#Adding text label Colour and text label string rotation
corrplot(input, method = “pie”,tl.col=”Black”,tl.srt = 20)
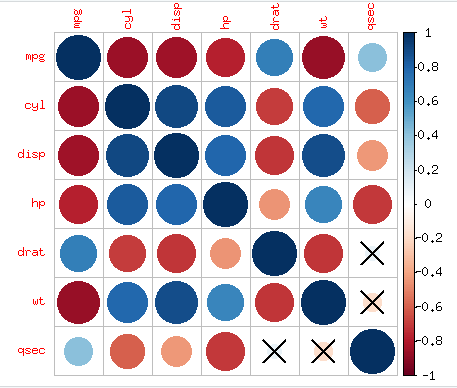
#Adding Significance level to the Correlogram
library(“Hmisc”)
input1<-rcorr(as.matrix(input))
print(input1)
pval<-as.matrix(input1$P)
print(pval)
corrplot(input,method=”circle”, p.mat= pval,sig.level=0.05)
#Leave blank on no significant coefficient
corrplot(input, method=”circle”,p.mat = pval,sig.level=0.05,insig=”blank”)