Research breakthrough possible @S-Logix
pro@slogix.in
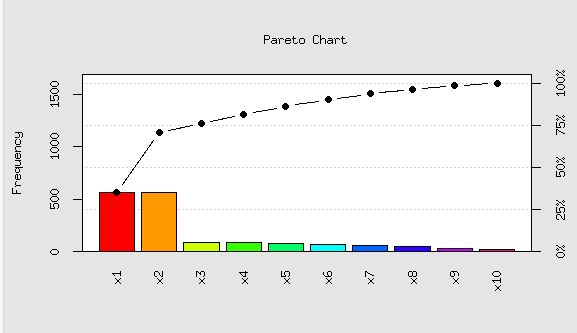
How to plot a Pareto Chart using R programming.
A Pareto chart is a barplot where the categories are ordered in non increasing order
A line is also added to show the cumulative sum(cumulative sum is similar to Fibonacci series)
R Package : qcc
R Function :chart()
#Pareto Chart
#Vector Input
x<-c(34,56,23,87,45,87,64,78,566,566)
#Sorting the vector in desending order
input<-sort(x,decreasing = TRUE)
print(input)
#Installing Package needed for pareto chart
#install.packages(“qcc”)
library(“qcc”)
#Pareto Chart
names(input)<-c(“x1″,”x2″,”x3″,”x4″,”x5″,”x6″,”x7″,”x8″,”x9″,”x10″)
pareto.chart(input,main=”ParetoChart”,col=rainbow(length(input)))
