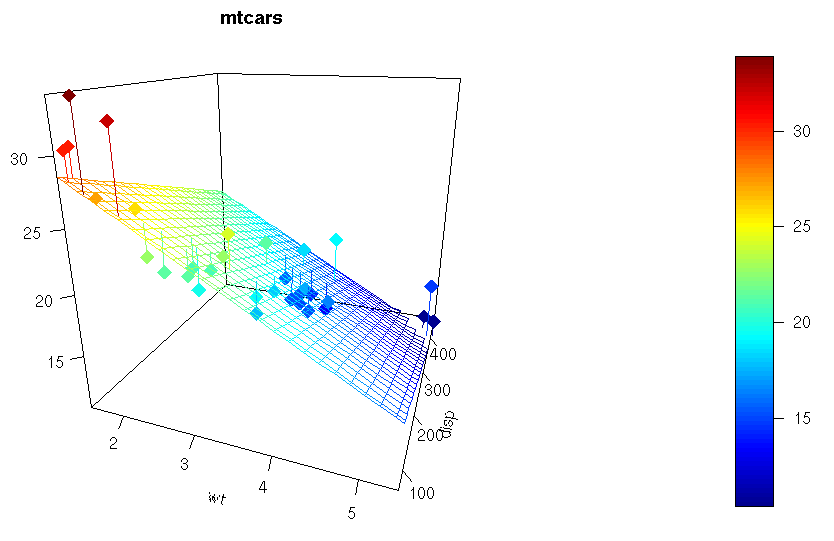
#Regression Plane
#Input
#x, y, z variables
x<-mtcars$wt
y<-mtcars$disp
z<-mtcars$mpg
# Compute the linear regression (z = ax + by + d)
fit<-lm(z ~ x + y)
#Predict values on regular xy grid
grid.lines<-25
x.pred<-seq(min(x), max(x), length.out = grid.lines)
y.pred<-seq(min(y), max(y), length.out = grid.lines)
xy<-expand.grid( x = x.pred, y = y.pred)
z.pred<-matrix(predict(fit, newdata = xy), nrow = grid.lines, ncol = grid.lines)
#Fitted points for droplines to surface
fitpoints<-predict(fit)
#Scatter plot with regression plane
scatter3D(x, y, z, pch = 18, cex = 2,
theta = 20, phi = 20, ticktype = “detailed”,
xlab = “wt”, ylab = “disp”, zlab = “mpg”,
surf = list(x = x.pred, y = y.pred, z = z.pred,
facets=NA,fit = fitpoints), main = “mtcars”)