Research breakthrough possible @S-Logix
pro@slogix.in
To implement Principal component Analysis in R
Load the necessary libraries
Load the data set
Perform a principal component analysis on the data
Take the summary
Visualize the result
require(MASS)
require(ggplot2)
require(scales)
require(gridExtra)
data=read.csv(‘/…./iris.csv’)
pca summary(pca)
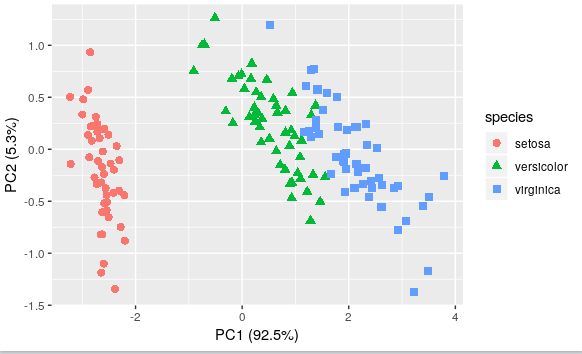
#To visualize the data separation
prop.pca = pca$sdev^2/sum(pca$sdev^2)
p2 labs(x = paste(“PC1 (“, percent(prop.pca[1]), “)”, sep=””),
y = paste(“PC2 (“, percent(prop.pca[2]), “)”, sep=””))
grid.arrange(p2)
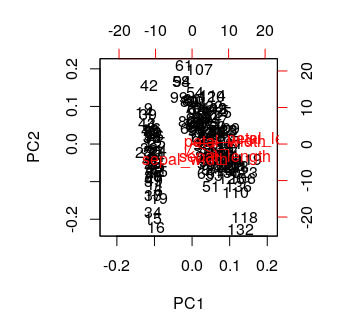
#To see how our features are transformed
biplot (pca)
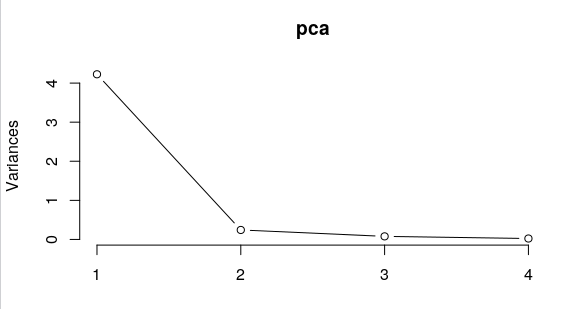
#To determine what should be an ‘ideal’ set of features we should take after using PCA
screeplot(pca, type=”lines”)


