To implement the simple linear regression model in R programming.
Step 1 : Import the data
Step 2 : Check Correlation between the variables
Step 3 : Create a relationship model using lm() function in R
Step 4 : Summary of the linear model using summary() function
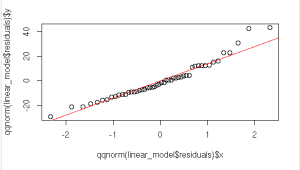
Step 5: Check normality of the residuals.
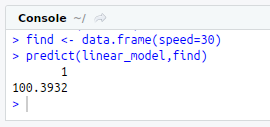
Step 6 : Predicting the dependent variable using predict() function.
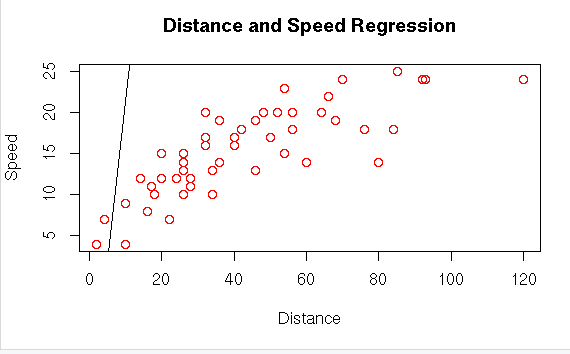
Step 7 : Visualizing the regression graphically.
#Simple Linear Regression Model
#install caret package
#install.packages(“caret”)
library(“caret”)
#Get and Set Working Directory
print(getwd())
setwd(“/home/soft13”)
getwd()
#Read file from Excel
#install.packages(“xlsx”)
library(“xlsx”)
data<-read.xlsx(“ExcelInput.xlsx”,sheet=1)
print(data)
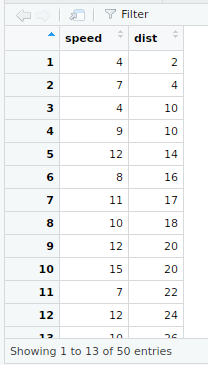
View(data)
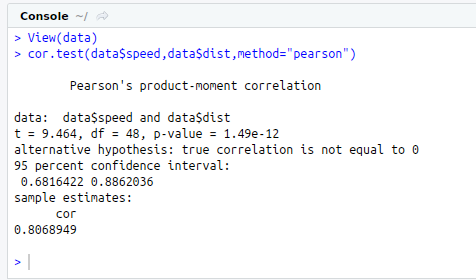
#Test Correlation
cor.test(data$speed,data$dist,method=”pearson”)
#Simple Linear Regression
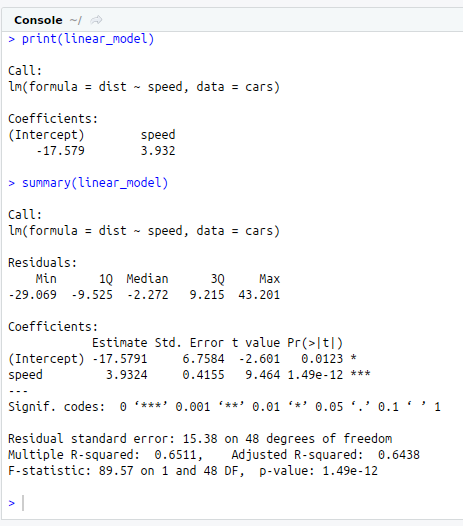
linear_model<-lm(dist ~ speed,data=cars)
print(linear_model)
summary(linear_model)
#Check Normality
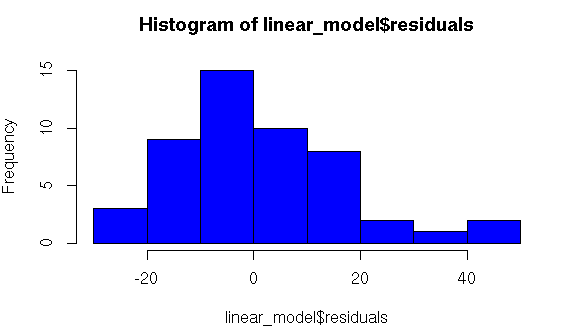
#Histogram Test for Normality
hist(linear_model$residuals,col=564)
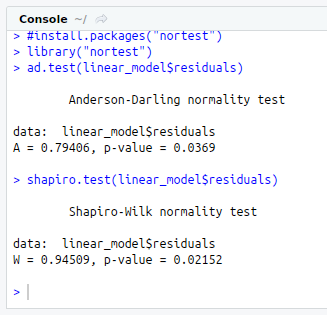
#Anderson – Darling test for Normality
#install.packages(“nortest”)
library(“nortest”)
ad.test(linear_model$residuals)
#Shapiro-Wilk test for Normality
shapiro.test(linear_model$residuals)
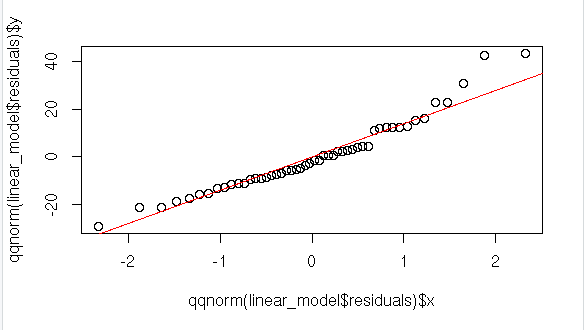
#Q-Q plot
plot(qqnorm(linear_model$residuals))
#Generating a line for Q-Q plot
qqline (linear_model$residuals, col=2)
#Density plot
plot(density(linear_model$residuals))
polygon(density(linear_model$residuals),col=”red”)
#Predicting the dependent variable
find<-data.frame(speed=30)
predict(linear_model,find)
#Visualize the regression graphically
plot(data$dist,data$speed,xlab=”Distance”,ylab=”Speed”,main=”Distance and Speed Regression”,col=”red”)
abline(linear_model)
#ANOVA
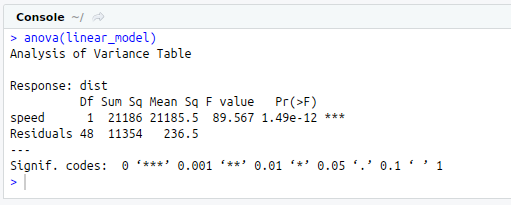
anova(linear_model)
