To implement the multiple linear regression in R programming.
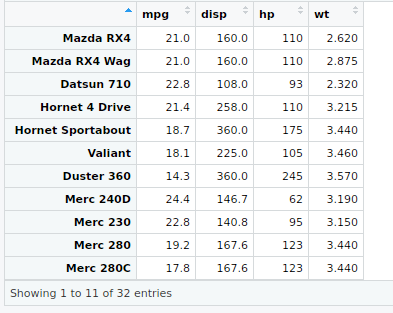
Step 1 : Import the data
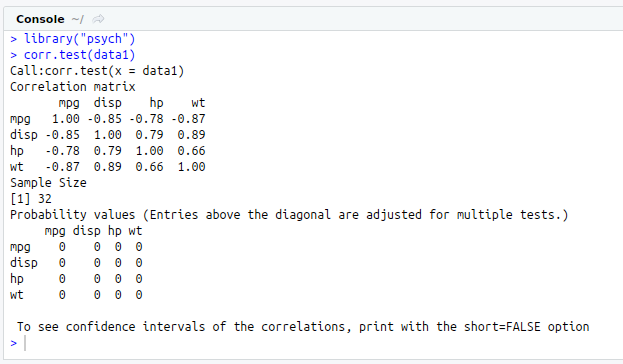
Step 2 : Check Correlation between the variables
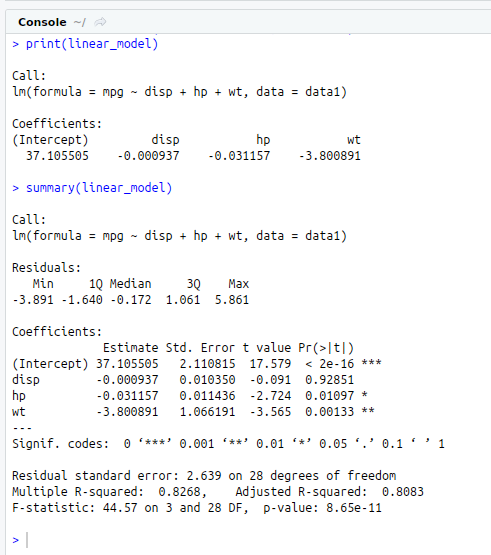
Step 3 : Create a relationship model using lm() function in R
Step 4 : Summary of the linear model using summary() function
Step 5: Check normality o the residuals.
Step 6 : Visualizing the regression graphically.
Step 7 : Predicting the dependent variable for two or more independent variable using predict() function.
#Multiple Linear Regression Model
#Get and Set Working Directory
print(getwd())
setwd(“/home/soft13”)
getwd()
#Read file from Excel
#install.packages(“xlsx”)
library(“xlsx”)
data<-read.xlsx(“mtcars.xlsx”,sheetIndex=1)
data1<-mtcars[,c(“mpg”,”disp”,”hp”,”wt”)]
View(data1)
#Correlation Test
#install.packages(“psych”)
library(“psych”)
corr.test(data1)
#Multiple Linear Regression Model
linear_model<-lm(mpg~disp+hp+wt,data=data1)
print(linear_model)
summary(linear_model)
#Check Normality
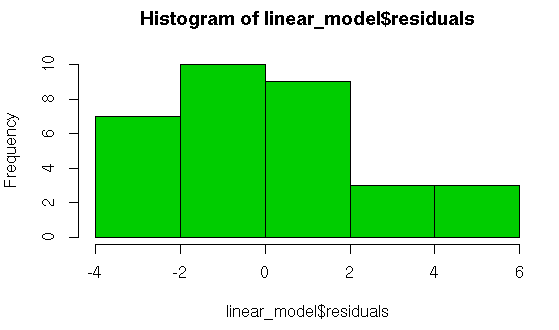
#Histogram
hist(linear_model$residuals,col=75)
#install.packages(“nortest”)
library(“nortest”)
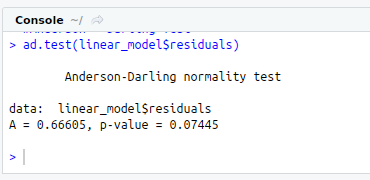
#Anderson – Darling Test
ad.test(linear_model$residuals)
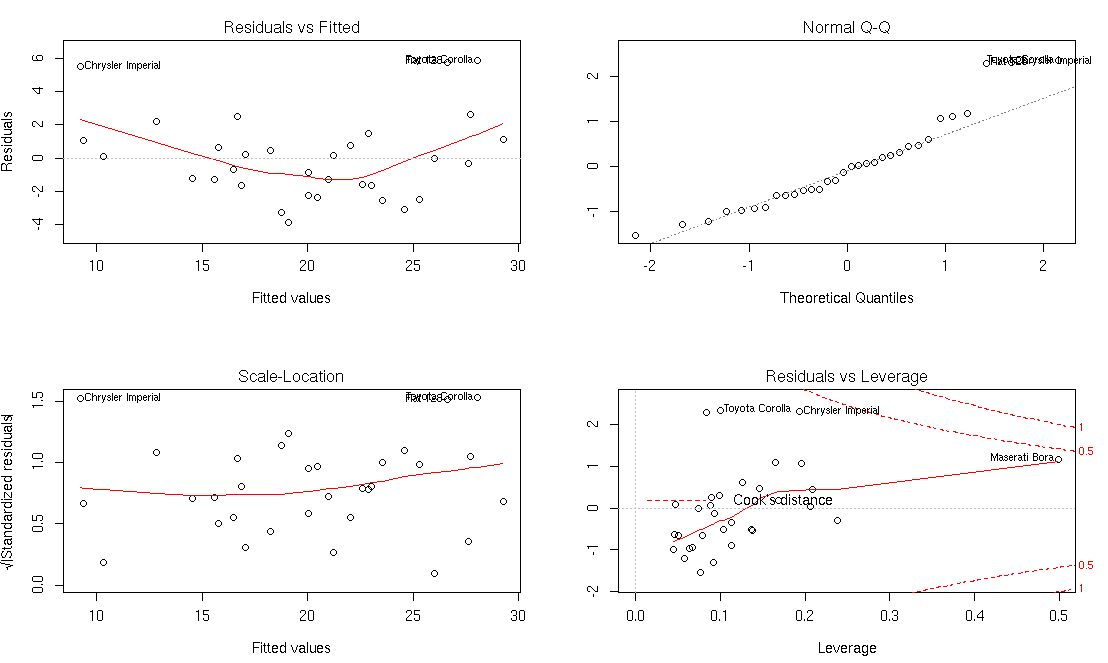
#Regression Diagnostics
par(mfrow = c(2, 2))
plot(linear_model)
#Confidence Interval
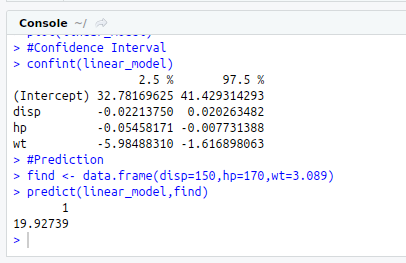
confint(linear_model)
#Prediction
find<-data.frame(disp=150,hp=170,wt=3.089)
predict(linear_model,find)
