Research Breakthrough Possible @S-Logix pro@slogix.in

Office Address

Social List

How to Create Cross Table Using Python

Create Cross Table Using Python

Condition for Creating Cross Table in Python

  • Description:
    A cross table, also known as a contingency table, is used to summarize the relationship between two categorical variables in tabular format.

    It shows the frequency or counts for combinations of categories, making it a useful tool for understanding how variables interact.

    Steps: 1. Import libraries like pandas.
    2. Prepare a dataset with at least two categorical columns.
    3. Use pd.crosstab() to create the cross table.
    4. Customize the table by adding margins for totals or normalizing data for proportions.
    5. Display the table to inspect the result.

Step-by-Step Process
  • Import Libraries:
    Import pandas for data manipulation with import pandas as pd.
  • Create or Load Data:
    Prepare a dataset with at least two categorical columns.
  • Create the Cross Table:
    Use pd.crosstab() to create the cross table between the two categorical variables.
  • Customize the Table:
    You can add margins for totals with the margins=True option, or normalize the table to show proportions.
  • Display the Table:
    Print the table to inspect the result.
Sample Source Code
  • # Code for Creating Cross Table

    import pandas as pd

    data = {
    'Gender': ['Male', 'Female', 'Female', 'Male', 'Male', 'Female', 'Female', 'Male', 'Male', 'Female'],
    'Purchased': ['Yes', 'No', 'Yes', 'Yes', 'No', 'Yes', 'No', 'No', 'Yes', 'No']
    }
    df = pd.DataFrame(data)

    # Create a cross table using pd.crosstab
    cross_table = pd.crosstab(df['Gender'], df['Purchased'])

    # Display the cross table
    print("Cross Table (Counts):")
    print(cross_table)

    # Create a normalized cross table (proportions)
    normalized_table = pd.crosstab(df['Gender'], df['Purchased'], normalize='index')
    print("\nCross Table (Proportions):")
    print(normalized_table)

    # Create a cross table with margins (totals)
    table_with_totals = pd.crosstab(df['Gender'], df['Purchased'], margins=True)
    print("\nCross Table with Totals:")
    print(table_with_totals)
Screenshots
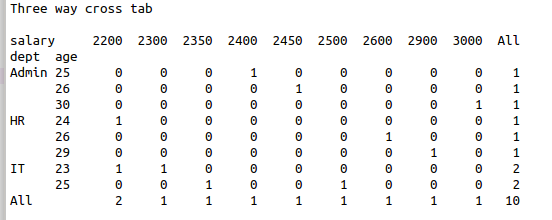
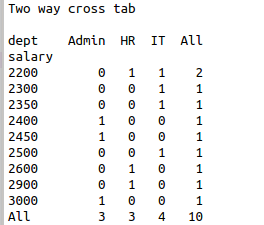
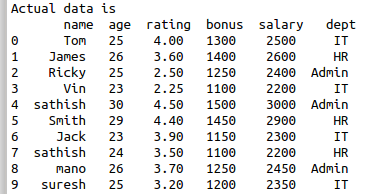
  • Create Cross Table Using Python