List of Topics:
Location Research Breakthrough Possible @S-Logix pro@slogix.in

Office Address

Social List

How to Build a Traffic Situation Classification Model Using Simple RNN with Time Series Data

Traffic Situation Classification Model with Simple RNN

Condition for Traffic Situation Classification Using Simple RNN on Time Series Data

  • Description:
    A Simple RNN model to classify traffic situations based on time-series data. It preprocesses the dataset by handling missing values, encoding categorical variables, and scaling the features. The model is trained and evaluated using metrics such as accuracy, F1-score, and confusion matrix.
Step-by-Step Process
  • Import Libraries:
    Import essential libraries like pandas, numpy, and TensorFlow for data processing and model building.
  • Load and Inspect Data:
    Load traffic-related data from CSV files and inspect its quality.
  • Preprocess Data:
    Handle missing values, encode categorical variables, and scale input features.
  • Build and Train Model:
    Build a Simple RNN model and train it on preprocessed data.
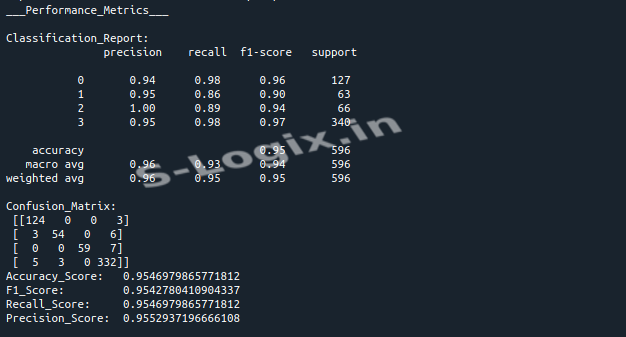
  • Evaluate and Visualize:
    Evaluate the model's performance using accuracy, F1-score, and confusion matrix.
Sample Source Code
  • # Import Necessary Libraries
    import pandas as pd
    import numpy as np
    from sklearn.preprocessing import LabelEncoder, StandardScaler
    import matplotlib.pyplot as plt
    import seaborn as sns
    from sklearn.model_selection import train_test_split

    import warnings
    warnings.filterwarnings("ignore")

    from tensorflow.keras.layers import Input, SimpleRNN, Dense
    from tensorflow.keras.models import Model

    from sklearn.metrics import (classification_report, confusion_matrix, accuracy_score, f1_score, recall_score, precision_score)

    df = pd.read_csv("/home/soft12/Downloads/sample_dataset/Website/Dataset/Traffic.csv")

    # Check Nan values
    print("Check Nan values\n")
    print(df.isna().sum())

    # If Nan values present
    df = df.dropna()

    # Check Null Values
    print("Check Null Values\n")
    print(df.isnull().sum())

    # Check dtypes of features
    print(df.dtypes)

    # Convert the time column to a datetime object
    df['Time'] = pd.to_datetime(df['Time'], format='%I:%M:%S %p').dt.time

    # Split into hours, minutes, and seconds
    df['hours'] = pd.to_datetime(df['Time'], format='%H:%M:%S').dt.hour
    df['minutes'] = pd.to_datetime(df['Time'], format='%H:%M:%S').dt.minute
    df['seconds'] = pd.to_datetime(df['Time'], format='%H:%M:%S').dt.second

    df = df.drop('Time',axis=1)

    label = LabelEncoder()

    for i in df.columns:
    if df[i].dtypes == 'object':
    df[i] = label.fit_transform(df[i])

    # Compute the correlation matrix
    correlation_matrix = df.corr()

    # Display the correlation matrix
    print(correlation_matrix)

    # Plot the heatmap
    plt.figure(figsize=(10, 8))
    sns.heatmap(correlation_matrix, annot=True, cmap='coolwarm', fmt='.2f', linewidths=0.5)
    plt.title('Correlation Heatmap')
    plt.show()

    x = df.drop('Traffic Situation', axis=1)
    y = df['Traffic Situation']

    # Scaling the input data
    scaler = StandardScaler()
    x = scaler.fit_transform(x)

    # Reshape x for SimpleRNN model
    x = x.reshape(x.shape[0], 1, x.shape[1])

    # Split the train_test_data
    X_train, X_test, y_train, y_test = train_test_split(x, y, test_size=.2, random_state=42)

    def RNN_model(input_shape):

    inputs = Input(shape=(input_shape))

    # RNN layers
    rnn_layer1 = SimpleRNN(64, return_sequences=True)(inputs)
    rnn_layer2 = SimpleRNN(32, return_sequences=False)(rnn_layer1)

    output_layer = Dense(4, activation='softmax')(rnn_layer2)

    # Build the model
    rnn_model = Model(inputs=inputs, outputs=output_layer)

    # Compile the model with Adam optimizer and mean squared error loss function
    rnn_model.compile(optimizer='adam', loss='sparse_categorical_crossentropy', metrics=['accuracy'])

    return rnn_model

    model = RNN_model((X_train.shape[1], X_train.shape[2]))

    # Summary of model
    model.summary()

    model.fit(X_train, y_train, batch_size=2, epochs=10, validation_data=(X_test, y_test))

    y_pred = model.predict(X_test)
    y_pred = [np.argmax(i) for i in y_pred]

    print("___Performance_Metrics___\n")
    print('Classification_Report:\n', classification_report(y_test, y_pred))
    print('Confusion_Matrix:\n', confusion_matrix(y_test, y_pred))
    print('Accuracy_Score: ', accuracy_score(y_test, y_pred))
    print('F1_Score: ', f1_score(y_test, y_pred, average='weighted'))
    print('Recall_Score: ', recall_score(y_test, y_pred, average='weighted'))
    print('Precision_Score: ', precision_score(y_test, y_pred, average='weighted'))

Screenshots
  • Simple RNN Traffic Classification Model Output