How to Build and Evaluate an LSTM Model for Breast Cancer Classification
Share
Condition for Building and Evaluating an LSTM Model for Breast Cancer Classification
Description: Condition for building and evaluating an LSTM model for breast cancer classification involves preprocessing the dataset, including label encoding and feature scaling. The model is trained using an LSTM layer to predict cancer diagnosis, followed by evaluation using classification metrics. Performance is assessed through accuracy, F1 score, recall, precision, and a confusion matrix heatmap.
Step-by-Step Process
Import Necessary Libraries: Necessary libraries such as Pandas, Scikit-Learn, TensorFlow, and Seaborn are imported for data handling, model building, and evaluation. Visualization libraries Matplotlib and Seaborn are included for plotting.
Load the Dataset: The breast cancer dataset is loaded using Pandas read_csv() from the given file path. The dataset contains various features for prediction and the target variable "diagnosis."
Data Preprocessing: The code checks for missing values using isnull().sum(), ensuring that the dataset is complete before processing.
Feature Selection: The correlation matrix of features is computed to identify relationships between them, and a heatmap is plotted to visualize these correlations.
Label Encoding and Scaling: The target variable 'diagnosis' is label-encoded using LabelEncoder(), and features are standardized using StandardScaler().
Reshape Data for LSTM: The data is reshaped into a 3D array to be suitable for input into an LSTM model.
Build and Train LSTM Model: The LSTM model is built and trained for 10 epochs with a batch size of 16.
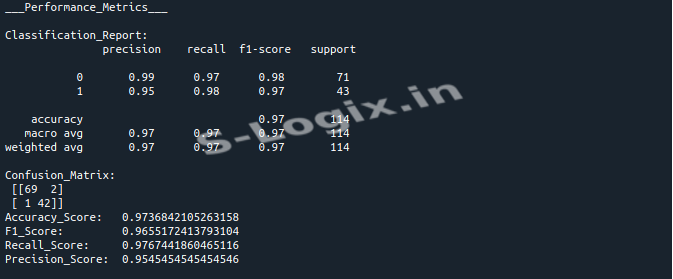
Model Evaluation: The model's performance is evaluated using accuracy, F1 score, recall, precision, and a confusion matrix heatmap.
Sample Source Code
# Import Necessary Libraries
import pandas as pd
import matplotlib.pyplot as plt
import seaborn as sns
from sklearn.preprocessing import LabelEncoder, StandardScaler
from sklearn.model_selection import train_test_split
from tensorflow.keras.layers import LSTM, Dense, Input
from tensorflow.keras.models import Model
from sklearn.metrics import (classification_report, confusion_matrix, accuracy_score, f1_score, recall_score, precision_score)
# Build the model
lstm_model = Model(inputs=inputs, outputs=output_layer)
# Compile the model with Adam optimizer and binary crossentropy loss function
lstm_model.compile(optimizer='adam', loss='binary_crossentropy', metrics=['accuracy'])
return lstm_model
input_shape = (X_train.shape[1], X_train.shape[2])
model = LSTM_model(input_shape)
 Research Breakthrough Possible @S-Logix