List of Topics:
Location Research Breakthrough Possible @S-Logix pro@slogix.in

Office Address

Social List

How to Implement Binary Classification for Heart Disease Detection Using Deep Learning

Image Classification Model with MobileNetV2

Condition for Implementing Binary Classification for Heart Disease Detection Using Deep Learning

  • Description:
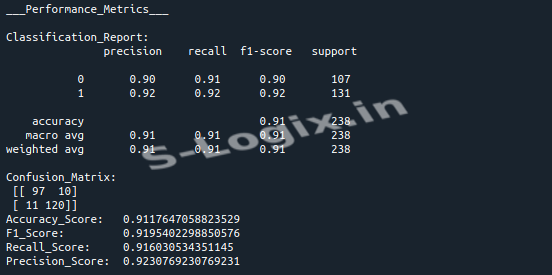
    This code demonstrates the implementation of a Deep Neural Network (DNN) for predicting heart disease using a dataset of medical features. It performs data preprocessing, including handling missing values and scaling, before training the model with binary classification. The model is evaluated using various performance metrics like accuracy, F1 score, and a confusion matrix.
Step-by-Step Process
  • Import Libraries:
    Import essential libraries like numpy, pandas, matplotlib, seaborn, tensorflow, and sklearn for data preprocessing and model building.
  • Load and Inspect Data:
    Load the heart disease dataset and inspect its structure, checking for missing values.
  • Preprocess Data:
    Handle missing values, scale input features, and split the dataset into training and testing sets.
  • Build and Train Model:
    Define a Deep Neural Network model using Keras and train it with the preprocessed data.
  • Evaluate and Visualize:
    Evaluate the model using performance metrics such as accuracy, precision, recall, F1 score, and visualize the confusion matrix.
Sample Source Code
  • # Import Libraries
    import pandas as pd
    import matplotlib.pyplot as plt
    import seaborn as sns
    from sklearn.preprocessing import StandardScaler
    from sklearn.model_selection import train_test_split
    from tensorflow.keras.layers import Dense, Input
    from tensorflow.keras.models import Model
    from sklearn.metrics import (classification_report, confusion_matrix, accuracy_score, f1_score, recall_score, precision_score)

    df = pd.read_csv("/home/soft12/Downloads/sample_dataset/Website/Dataset/heart_statlog_cleveland_hungary_final.csv")

    # Check Nan values
    print("Check Nan values\n")
    print(df.isna().sum())

    # If Nan values present
    df = df.dropna()

    # Check Null Values
    print("Check Null Values\n")
    print(df.isnull().sum())

    # Check dtypes of features
    print(df.dtypes)

    # Compute the correlation matrix
    correlation_matrix = df.corr()

    # Display the correlation matrix
    print(correlation_matrix)

    # Plot the heatmap
    plt.figure(figsize=(10, 8))
    sns.heatmap(correlation_matrix, annot=True, cmap='coolwarm', fmt='.2f', linewidths=0.5)
    plt.title('Correlation Heatmap')
    plt.show()

    x = df.drop('target', axis=1)
    y = df['target']

    # Count the number of samples per class
    class_counts = y.value_counts()

    # Plot the class distribution
    plt.figure(figsize=(8, 6))
    sns.barplot(x=class_counts.index, y=class_counts.values, palette="viridis")
    plt.title('Class Balance Check', fontsize=16)
    plt.xlabel('Class', fontsize=14)
    plt.ylabel('Count', fontsize=14)
    plt.xticks(fontsize=12)
    plt.yticks(fontsize=12)
    plt.grid(axis='y', linestyle='--', alpha=0.7)
    plt.show()

    # Scaling the input data
    scaler = StandardScaler()
    x = scaler.fit_transform(x)

    # Split the train_test_data
    X_train, X_test, y_train, y_test = train_test_split(x, y, test_size=.2, random_state=42)

    def DNN_model(input_shape):
    # Input layer
    inputs = Input(shape=(input_shape,))
    # Hidden layers
    layer1 = Dense(32, activation='relu')(inputs)
    layer2 = Dense(16, activation='relu')(layer1)
    # Output layer
    output_layer = Dense(1, activation='sigmoid')(layer2)
    # Build the model
    ann_model = Model(inputs=inputs, outputs=output_layer)
    # Compile the model
    ann_model.compile(optimizer='adam', loss='binary_crossentropy', metrics=['accuracy'])
    return ann_model

    model = DNN_model(X_train.shape[1])

    # Summary of Model
    model.summary()

    model.fit(X_train, y_train, batch_size=2, epochs=50, validation_data=(X_test, y_test))

    y_pred = model.predict(X_test)
    y_pred = [1 if i > 0.5 else 0 for i in y_pred]

    # Calculate confusion matrix
    cm = confusion_matrix(y_test, y_pred)

    class_labels = ['Negative', 'Positive']

    # Plot the heatmap with correct labels
    plt.figure(figsize=(6, 5))
    sns.heatmap(cm, annot=True, fmt='d', cmap='Blues', xticklabels=class_labels, yticklabels=class_labels)
    plt.title('Confusion Matrix Heatmap')
    plt.xlabel('Predicted Label')
    plt.ylabel('True Label')
    plt.show()

    print("___Performance_Metrics___\n")
    print('Classification_Report:\n', classification_report(y_test, y_pred))
    print('Confusion_Matrix:\n', confusion_matrix(y_test, y_pred))
    print('Accuracy_Score: ', accuracy_score(y_test, y_pred))
    print('F1_Score: ', f1_score(y_test, y_pred))
    print('Recall_Score: ', recall_score(y_test, y_pred))
    print('Precision_Score: ', precision_score(y_test, y_pred))
Screenshots
  • Heart Disease Detection DNN Output Screenshot