import pandas as pd
import numpy as np
import matplotlib.pyplot as plt
import seaborn as sns
#load data set URL
url = “https://archive.ics.uci.edu/ml/machine-learning-databases/iris/iris.data”
names = [‘sepal-length’, ‘sepal-width’, ‘petal-length’, ‘petal-width’, ‘class’]
data = pd.read_csv(url, names=names)
df = pd.DataFrame(data)
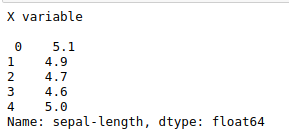
X = df[‘sepal-length’]
print(“X variable\n\n”,X.head())
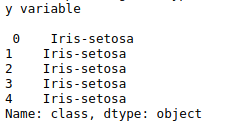
y = df[‘class’]
print(“y variable\n\n”,y.head())
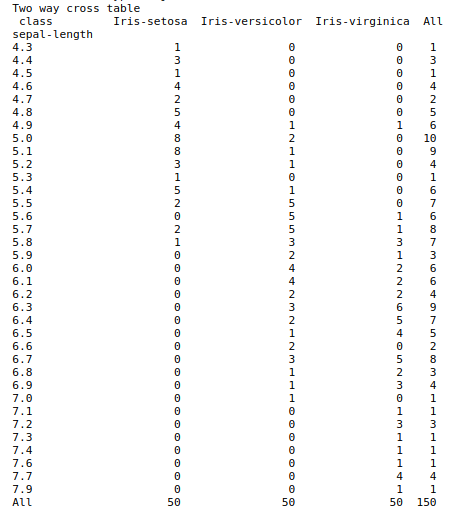
#Two way table
two_way = pd.crosstab(df[‘sepal-length’], df[‘class’],margins=True)
print(“Two way cross table\n”,two_way)
print(“\n”)
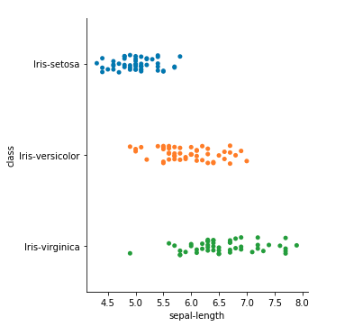
#scatter plot
ax = sns.catplot(x=”sepal-length”,y=”class”,data=df)
plt.show()
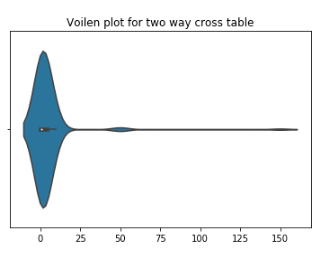
#voilen plot for bivariate
ax = sns.violinplot(x=two_way)
plt.title(“Voilen plot for two way cross table”)
plt.show()
print(“\n”)
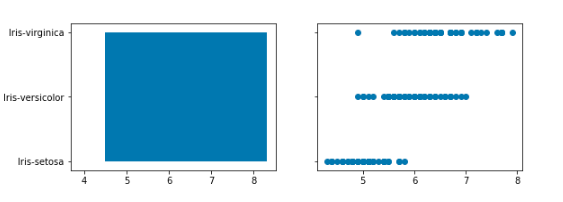
#bar chart representation
fig, axs = plt.subplots(1, 2, figsize=(9, 3), sharey=True)
axs[0].bar(df[‘sepal-length’], df[‘class’])
axs[1].scatter(df[‘sepal-length’], df[‘class’])
plt.title(“Bar chart and scatter plot for categorical variable\n\n\n”)
plt.show()
print(“\n”)
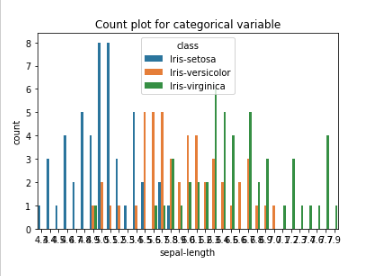
#bar chart for two way table
ax = sns.countplot(x=”sepal-length”, hue=”class”, data=df)
plt.title(“Count plot for categorical variable”)
plt.show()
print(“\n”)
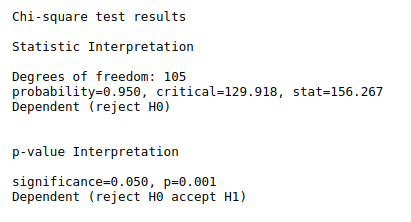
#chi-square test for categorical value
from scipy.stats import chi2_contingency
from scipy.stats import chi2
print(“Chi-square test results\n”)
#interpret test-statistic
print(“Statistic Interpretation\n”)
stat, p, dof, expected = chi2_contingency(two_way)
print(“Degrees of freedom:”,dof)
prob = 0.95
critical = chi2.ppf(prob, dof)
print(‘probability=%.3f, critical=%.3f, stat=%.3f’ % (prob, critical, stat))
if abs(stat) >= critical:
print(‘Dependent (reject H0)’)
else:
print(‘Independent (fail to reject H0)’)
print(“\n”)
#interpret p-value
print(“p-value Interpretation\n”)
alpha = 1.0 – prob
print(‘significance=%.3f, p=%.3f’ % (alpha, p))
if p <= alpha:
print(‘Dependent (reject H0 accept H1)’)
else:
print(‘Independent (fail to reject H0)’)
print(“\n”)