To implement PCA using python.
#import libraries
import pandas as pd
import numpy as np
import warnings
import seaborn as sns
import matplotlib.pyplot as plt
from sklearn.preprocessing import StandardScaler
from sklearn.decomposition import PCA
warnings.filterwarnings(“ignore”)
#load data set URL
url = “https://archive.ics.uci.edu/ml/machine-learning-databases/iris/iris.data”
names = [‘sepal-length’, ‘sepal-width’, ‘petal-length’, ‘petal-width’, ‘class’]
data = pd.read_csv(url, names=names)
x = data.drop(‘class’,1)
print(“Actual Features before standardizing\n\n”,x.head())
y = data[‘class’]
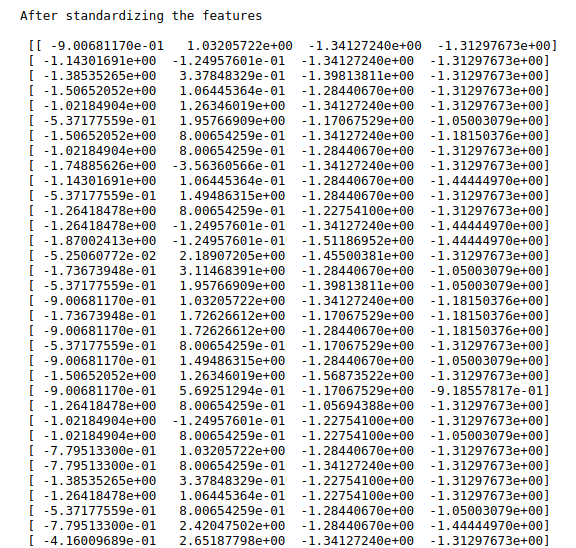
# Standardizing the features
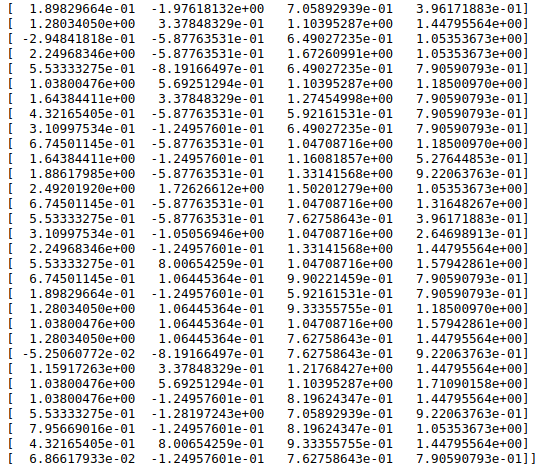
x = StandardScaler().fit_transform(x)
print(“\n”)
print(“After standardizing the features\n\n”,x)
print(“\n”)
#covariance matrix
covar_matrix = PCA(n_components = 4)
covar_matrix.fit(x)
variance = covar_matrix.explained_variance_ratio_
#Cumulative sum of variance
var=np.cumsum(np.round(variance, decimals=3)*100)
print(“Eigen values\n\n”,var)
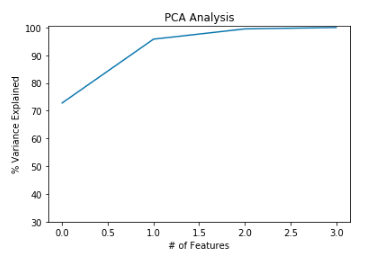
#plot for variance explained
plt.ylabel(‘% Variance Explained’)
plt.xlabel(‘# of Features’)
plt.title(‘PCA Analysis’)
plt.ylim(30,100.5)
plt.style.context(‘seaborn-whitegrid’)
plt.plot(var)
plt.show()
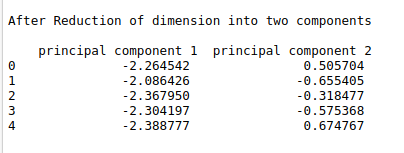
#fit PCA for 2 components
pca = PCA(n_components=2)
principalComponents = pca.fit_transform(x)
principalDf = pd.DataFrame(data = principalComponents
, columns = [‘principal component 1’, ‘principal component 2’])
print(“\n”)
print(“After Reduction of dimension into two components\n\n”,principalDf.head())
#concatenate with y variable
finalDf = pd.concat([principalDf, y], axis = 1)
print(“\n”)
print(“After concatenating with the target variable\n\n”,finalDf.head())
#Visualize the principal components
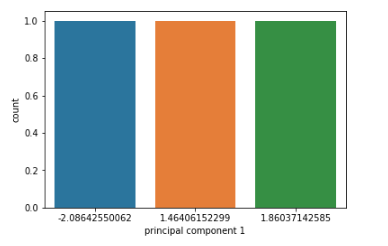
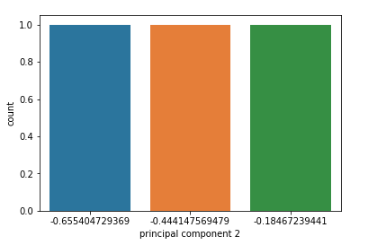
def visual(df):
df = df.sample(3)
ax = sns.countplot(x=”principal component 1″, data=df)
plt.show()
ax = sns.countplot(x=”principal component 2″, data=df)
plt.show()
visual(finalDf)
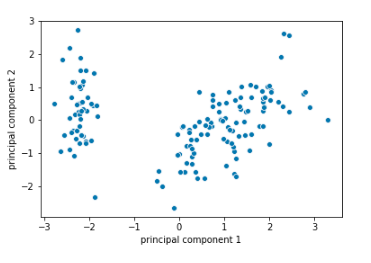
#Scatter plot
ax = sns.scatterplot(x=”principal component 1″, y=”principal component 2″, data=finalDf)
plt.show()
print(“\n”)
#Explained variance
print(“The explained variance ratio is\n\n”,pca.explained_variance_ratio_*100)

