To analyse the furniture sales data in superstore sales data set in python.
#import libraries
import warnings
import itertools
import numpy as np
import matplotlib.pyplot as plt
%matplotlib inline
warnings.filterwarnings(“ignore”)
plt.style.use(‘fivethirtyeight’)
import pandas as pd
import statsmodels.api as sm
import matplotlib
from statsmodels.tsa.stattools import adfuller
#Reading the data
data = pd.read_excel(“/home/soft23/soft23
/Sathish/Casestudies/Superstore.xls”)
furniture = data.loc[data[‘Category’] == ‘Furniture’]
#unwanted columns
cols = [‘Row ID’, ‘Order ID’, ‘Ship Date’, ‘Ship Mode’, ‘Customer ID’, ‘Customer Name’, ‘Segment’,
‘Country’, ‘City’, ‘State’, ‘Postal Code’, ‘Region’, ‘Product ID’, ‘Category’, ‘Sub-Category’,
‘Product Name’, ‘Quantity’, ‘Discount’, ‘Profit’]
furniture.drop(cols, axis=1, inplace=True)
furniture = furniture.sort_values(‘Order Date’)
df = pd.DataFrame(furniture)
df = furniture.set_index(‘Order Date’)
print(“Index of the data frame\n\n”,df.index)
ts = df[‘Sales’].resample(‘MS’).mean()
print(“\n”)
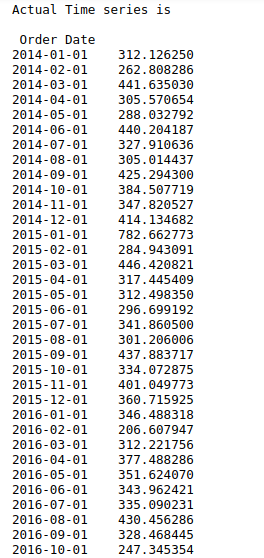
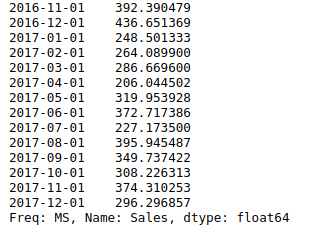
print(“Actual Time series is\n\n”,ts)
print(“\n”)
#total length of time series
print(“Length of time series in months:”,len(ts))
print(“\n”)
#First 5 rows of time series
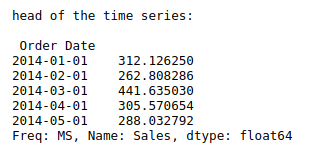
print(“head of the time series:\n\n”,ts.head())
print(“\n”)
#check stationarity
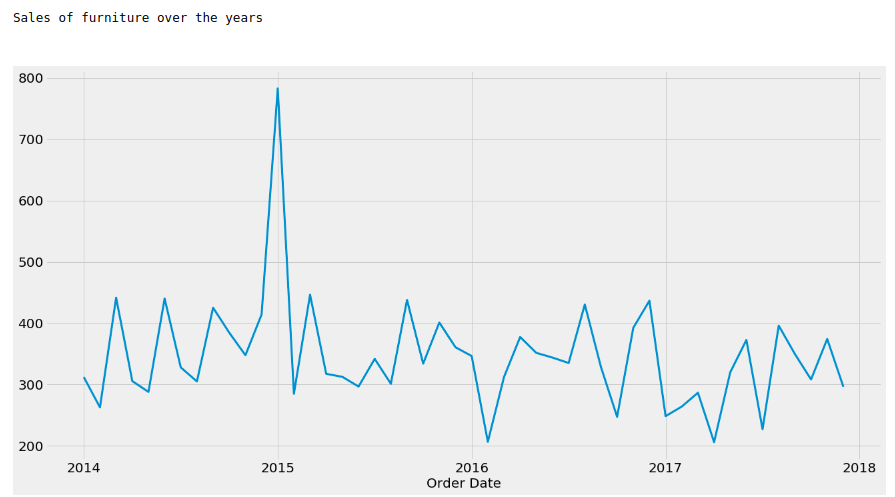
print(“Sales of furniture over the years\n\n”)
ts.plot(figsize=(20,10), linewidth=3, fontsize=20)
plt.xlabel(‘Order Date’,fontsize=20)
plt.show()
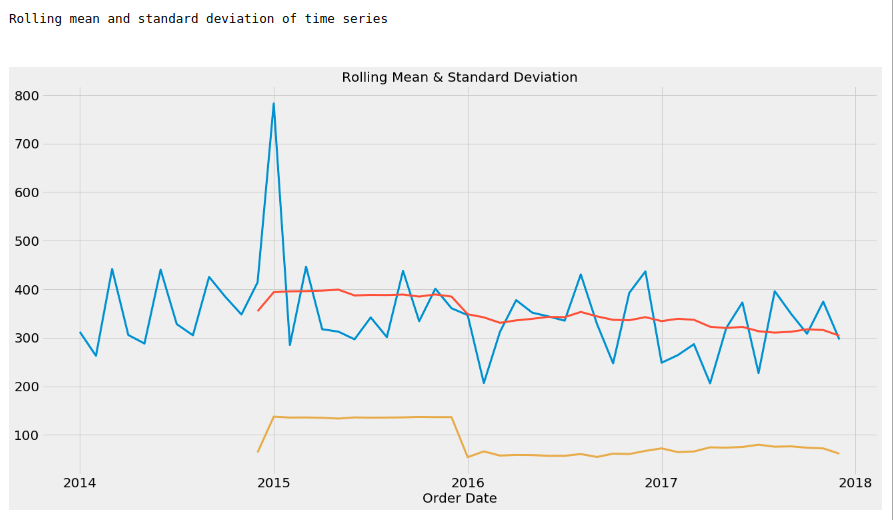
print(“Rolling mean and standard deviation of time series\n\n”)
def test_stationarity(timeseries):
#Determing rolling statistics
rolmean = timeseries.rolling(window=12).mean()
rolstd = timeseries.rolling(window=12).std()
#Plot rolling statistics
timeseries.plot(figsize=(20,10), linewidth=3, fontsize=20)
plt.xlabel(‘Order Date’,fontsize=20)
rolmean.plot(figsize=(20,10), linewidth=3, fontsize=20)
plt.xlabel(‘Order Date’,fontsize=20)
rolstd.plot(figsize=(20,10), linewidth=3, fontsize=20)
plt.xlabel(‘Order Date’,fontsize=20)
plt.title(‘Rolling Mean & Standard Deviation’)
plt.show()
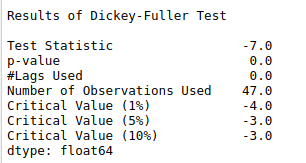
#Perform Dickey-Fuller test
print (‘Results of Dickey-Fuller Test\n’)
dftest = adfuller(timeseries, autolag=’AIC’)
dfoutput = pd.Series(dftest[0:4], index=[‘Test Statistic’,’p-value’,’#Lags Used’,’Number of bservations Used’])
for key,value in dftest[4].items():
dfoutput[‘Critical Value (%s)’%key] = value
print(round(dfoutput))
test_stationarity(ts)
from pylab import rcParams
rcParams[‘figure.figsize’] = 18, 8
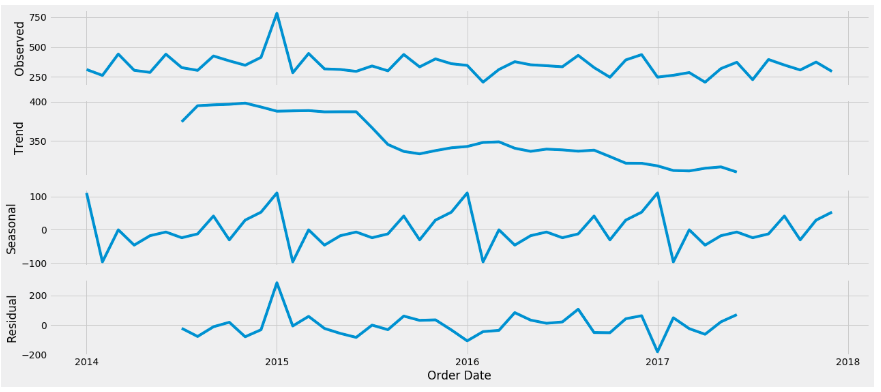
decomposition = sm.tsa.seasonal_decompose(ts, model=’additive’)
fig = decomposition.plot()
plt.show()
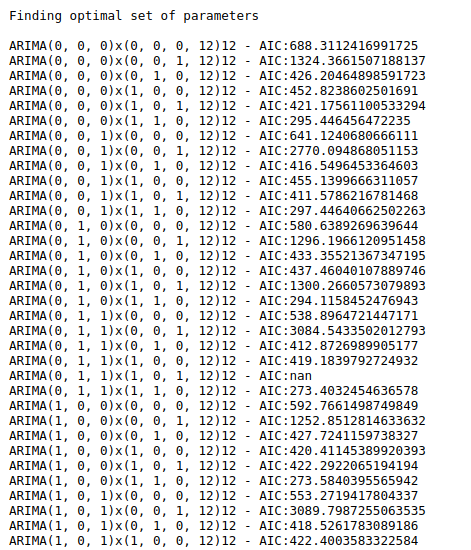
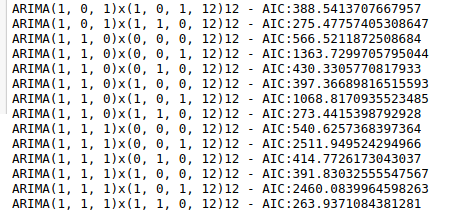
#Find minimum AIC value
print(“Finding optimal set of parameters\n”)
p = d = q = range(0, 2)
pdq = list(itertools.product(p, d, q))
seasonal_pdq = [(x[0], x[1], x[2], 12) for x in list(itertools.product(p, d, q))]
for param in pdq:
for param_seasonal in seasonal_pdq:
try:
mod = sm.tsa.statespace.SARIMAX(ts,order
=param,seasonal_order=param_seasonal,enforce_stationarity=False,
enforce_invertibility=False)
results = mod.fit()
print(‘ARIMA{}x{}12 – AIC:{}’.format(param, param_seasonal, results.aic))
except:
continue
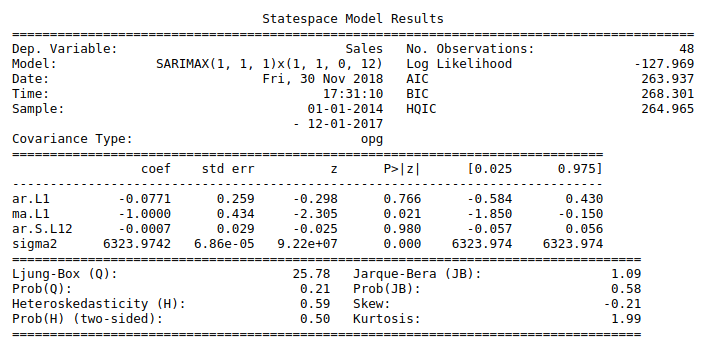
#Fit ARIMA model
print(“\n”)
mod = sm.tsa.statespace.SARIMAX(ts,order=(1, 1, 1),seasonal_order=(1, 1, 0, 12),enforce_stationarity=False,
enforce_invertibility=False)
results = mod.fit()
print(results.summary())
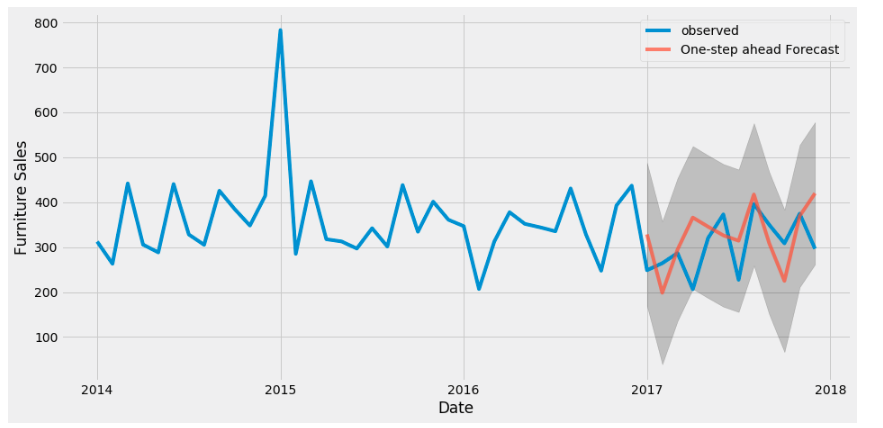
pred = results.get_prediction(start=pd.to_datetime
(‘2017-01-01’), dynamic=False)
pred_ci = pred.conf_int()
ax = ts[‘2014′:].plot(label=’observed’)
pred.predicted_mean.plot(ax=ax, label=’One-step ahead Forecast’, alpha=.7, figsize=(14, 7))
ax.fill_between(pred_ci.index,pred_ci.iloc[:, 0],pred_ci.iloc[:, 1], color=’k’, alpha=.2)
ax.set_xlabel(‘Date’)
ax.set_ylabel(‘Furniture Sales’)
plt.legend()
plt.show()

