Research Breakthrough Possible @S-Logix pro@slogix.in

Office Address

Social List

How to View the Summary of a Linear Regression Model Using Statsmodels in Python?

Linear Regression Model Summary using Statsmodels Library in Python

Condition for Linear Regression Model Summary using Statsmodels Library in Python

  • Description:
    Linear Regression is a statistical approach used to model the relationship between a dependent variable and one or more independent variables. In statsmodels, the Linear Regression model (OLS - Ordinary Least Squares) is implemented in such a way that it provides detailed statistical information aboutthe regression.The model helps in understanding how the dependent variable changes when the independent variables change,and it provides statistical metrics such as R-squared, p-values, coefficients, and confidence intervals, which are essential for model validation and interpretation.
Why Should We Use Linear Regression?
  • Linear regression is one of the simplest and most commonly used techniques for predictive modeling. The reasons to use linear regression include:
  • Simplicity and Interpretability: It’s easy to understand and interpret the relationships between variables.
  • Baseline Model: It provides a good baseline model for comparison with more complex models.
  • Statistical Significance: Helps to identify which variables are statistically significant predictors of the target variable.
Step-by-Step Process
  • Import Required Libraries: Start by importing the necessary libraries, such as statsmodels, numpy, pandas, and matplotlib.
  • Load and Explore Dataset: Load your dataset using pandas and perform exploratory data analysis (EDA) to understand the data, check for missing values, and visualize relationships.
  • Example: Load a dataset
  • Prepare the Data: Clean the data (e.g., handle missing values, outliers, etc.).Choose the dependent variable (target) and independent variables (predictors).Add a constant to the independent variables matrix (for the intercept term).
  • Train-Test Split: Fit the OLS model using statsmodels by passing the independent and dependent variables.
  • Fit the Linear Regression Model: Use linear regression from libraries like scikit-learn to fit the model on the training data.
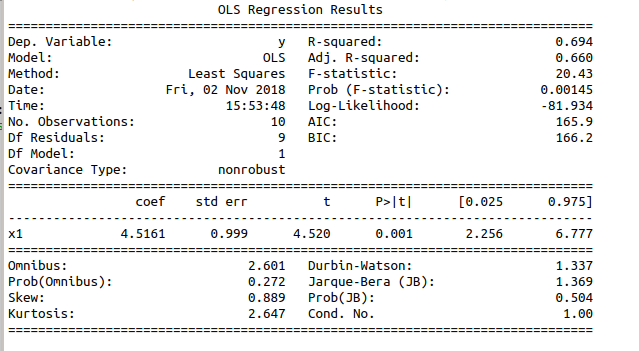
  • View the Model Summary: Print the summary of the model, which includes essential statistics like coefficients, p-values,R-squared, confidence intervals, and more.
  • Make Predictions: You can use the fitted model to make predictions on new data.
Sample Code
  • # Importing necessary libraries
    import statsmodels.api as sm
    import pandas as pd
    import numpy as np
    import seaborn as sns
    import matplotlib.pyplot as plt
    # Load dataset (for example, the built-in seaborn dataset 'tips')
    df = sns.load_dataset('tips')
    # Description of the dataset (you can choose a dataset as per your problem)
    # Here 'total_bill' is the independent variable and 'tip' is the dependent
    variable.
    X = df['total_bill'] # Independent variable
    y = df['tip'] # Dependent variable
    # Add a constant to the independent variable (for the intercept)
    X = sm.add_constant(X)
    # Fit the model using Ordinary Least Squares (OLS)
    model = sm.OLS(y, X).fit()
    # Print the summary of the regression
    print(model.summary())
    # Optional: Visualize the data and the regression line
    plt.scatter(df['total_bill'], df['tip'], label='Data points', color='blue')
    plt.plot(df['total_bill'], model.predict(X), label='Regression Line', color='red')
    plt.xlabel('Total Bill')
    plt.ylabel('Tip')
    plt.title('Linear Regression: Tip vs. Total Bill')
    plt.legend()
    plt.show()
Screenshots
  • Linear Regression Model Summary using Statsmodels