How to Identify a Frequent Flyer Program Based on Total Miles Traveled?
Share
Condition for Identifying a Frequent Flyer Program Based on Total Miles Traveled?
Description:
This project aims to classify frequent flyer programs for a set of travelers based on their total miles traveled.
The goal is to predict the most suitable frequent flyer program for a given traveler, helping them optimize their
rewards and benefits. The classification model will consider a variety of features like total miles flown, trip
frequency, and other attributes to determine the best frequent flyer program for the traveler.
Step-by-Step Process
Data Collection:
Gather data of travelers that includes the total miles traveled, flight frequencies, and other attributes
related to their flying patterns.
Data Preprocessing:
Handle missing values, normalize/standardize data, and perform exploratory data analysis (EDA) to understand
relationships in the data.
Feature Engineering:
Derive new features like travel frequency, average distance per trip, etc., which can help in classification.
Model Selection:
Choose appropriate classification models such as Logistic Regression, Random Forest, Decision Trees, or Gradient
Boosting.
Model Training:
Train the model using historical data.
Model Evaluation:
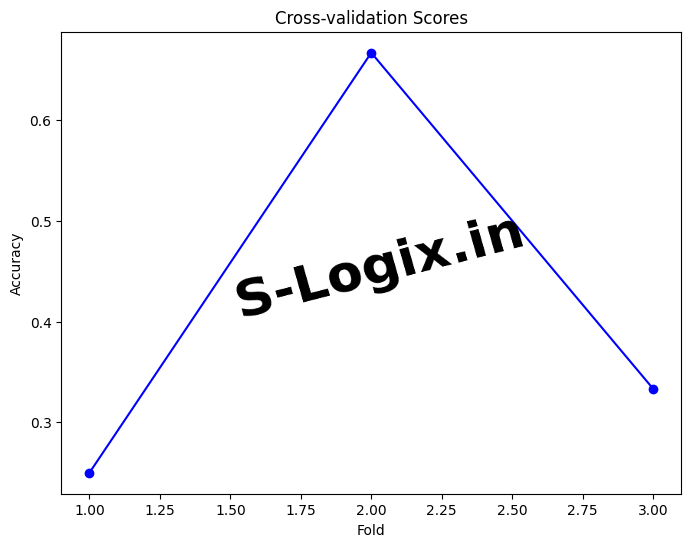
Evaluate the model using classification metrics such as Accuracy, Precision, Recall, F1-Score, and Confusion Matrix.
Visualization:
Generate heatmaps and plots to visualize feature importance, performance metrics, and other key insights.
Output Generation:
Predict the most suitable frequent flyer program for a new traveler based on their total miles traveled and other features.
Why Should We Choose This Approach?
Efficient Use of Miles:
Helps frequent travelers choose the right loyalty program to maximize their benefits.
Personalization:
Tailors recommendations based on individual travel patterns.
Predictive Analysis:
Uses machine learning to predict the best program, which can be continually refined with more data.
Easy Implementation:
Simple classification models can be used for initial testing, while complex models can be implemented as needed.
Sample Source Code
# Importing necessary libraries
import pandas as pd
import numpy as np
import matplotlib.pyplot as plt
import seaborn as sns
from sklearn.ensemble import RandomForestClassifier
from sklearn.model_selection import train_test_split, GridSearchCV, StratifiedKFold, cross_val_score
from sklearn.preprocessing import StandardScaler
from sklearn.metrics import classification_report, confusion_matrix
from sklearn.impute import SimpleImputer
# Save the data to a CSV file
data.to_csv('data.csv', index=False)
# Load the dataset
data = pd.read_csv('data.csv')
# Data Preprocessing
# Handling missing values (if any) using SimpleImputer
imputer = SimpleImputer(strategy='mean')
data = pd.DataFrame(imputer.fit_transform(data), columns=data.columns)
# Splitting the features and target variable
X = data[['total_miles', 'trip_count', 'average_trip_distance']] # Features
y = data['program_choice'] # Target variable
# Splitting the data into training and testing sets
X_train, X_test, y_train, y_test = train_test_split(X_scaled, y, test_size=0.3, random_state=42)
# Model Selection - Using Random Forest Classifier
model = RandomForestClassifier(random_state=42)
# Hyperparameter Tuning using GridSearchCV for better accuracy
param_grid = {
'n_estimators': [50, 100, 150], # Number of trees
'max_depth': [None, 10, 20, 30], # Maximum depth of trees
'min_samples_split': [2, 5, 10], # Minimum samples required to split a node
'min_samples_leaf': [1, 2, 4], # Minimum samples required to be at a leaf node
'bootstrap': [True, False] # Whether to use bootstrap samples
}
# Perform GridSearchCV to find the best hyperparameters
grid_search = GridSearchCV(estimator=model, param_grid=param_grid, cv=3, n_jobs=-1, verbose=2)
grid_search.fit(X_train, y_train)
# Best parameters from GridSearchCV
best_params = grid_search.best_params_
print(f"Best Parameters: {best_params}")
# Use the best model after GridSearchCV
best_model = grid_search.best_estimator_
 Research Breakthrough Possible @S-Logix