To cluster customers into groups based on the shopping behavior using Clustering Algorithm in R.
Step 1: Loading the required packages and import the data
Step 2: Data Preparation : Scaling (Normalizing) the input data and filling the missing values .
Step 3: Visualizing the data using ggplot2 and plotly R packages.
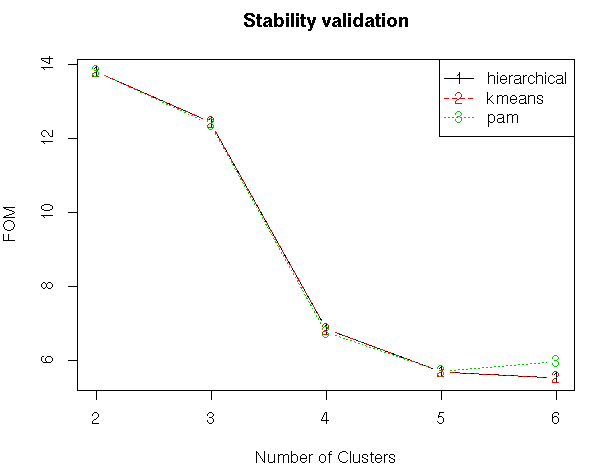
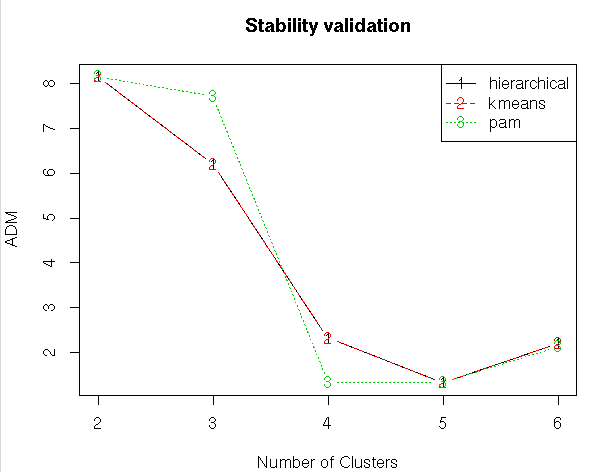
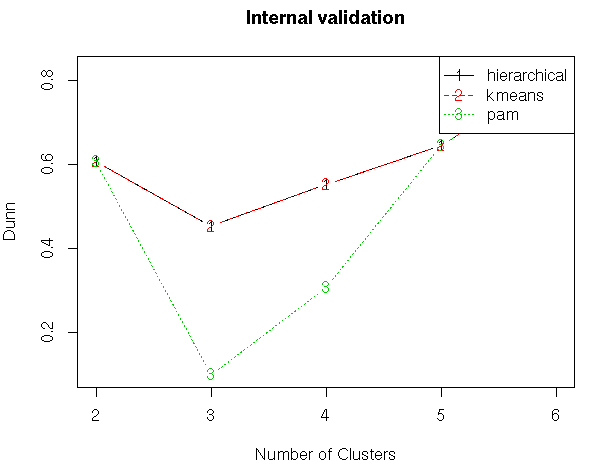
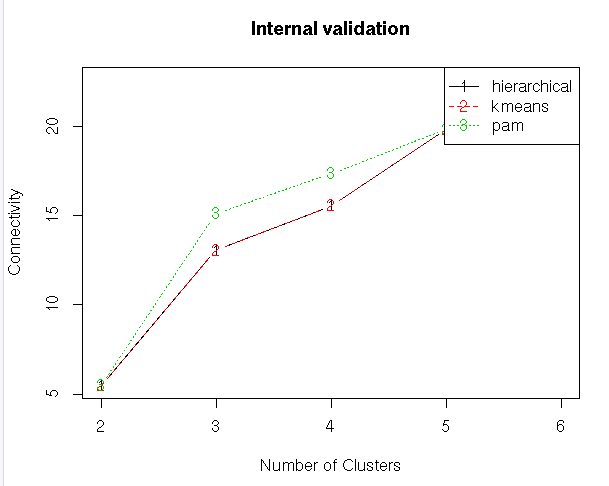
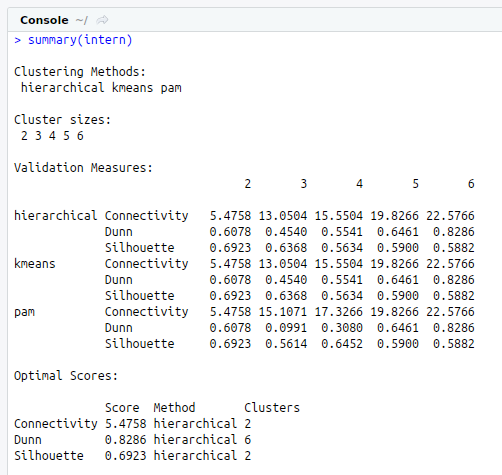
Step 4: Finding the best Clustering Algorithm for our data set using two validation techniques internal and stability.
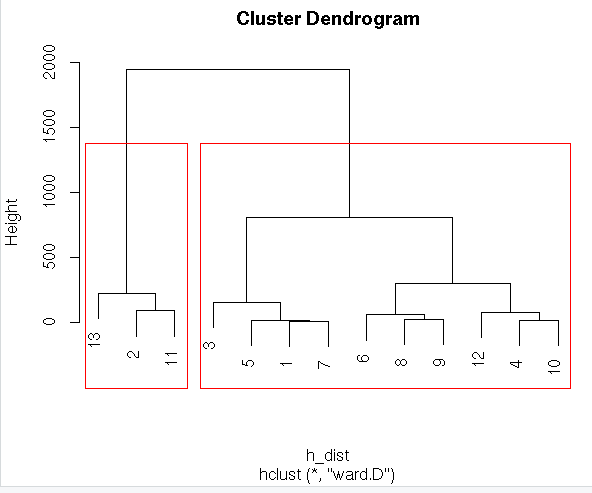
Step 5: Computing Hierarchical Clustering and plotting dendrogram
Step 6: Compare the average values in each of the variables for the 2 clusters (the centroids of the clusters).
#Online Shopping Survey
#Reading data from Excel
#install.packages(“xlsx”)
library(“xlsx”)
my_input<-read.xlsx(“OnlineShopping.xlsx”)
View(my_input)
#Descriptive Statistics
str(my_input)
summary(my_input)
#Data Preparation
#Checking Missing values
sum(is.na(my_input))
#ggplot2 age,name,online Shoppers
library(“ggplot2”)
#install.packages(“ggpubr”)
library(“ggpubr”)
library(“plotly”)
dot<-ggdotchart(my_input,x=”name”,y= “age”,color = “online_shopping”,group = “online_shopping”,ggtheme = theme_pubclean(),add=”segments”,sorting=”desc”,add.params = list(color = “lightgray”,size=3),dot.size = 4) + labs(title=”Plotting of Age, Name versus Online Shoppers using ggplotly”,x=”Name”,y=”Age”)
ggplotly(dot)
#Plotting of Commodity versus age
#install.packages(“ggridges”)
library(“ggridges”)
ggplot(my_input, aes(x = age, y = as.factor(commodity))) +
geom_density_ridges(aes(fill = as.factor(commodity))) +
scale_fill_manual(values = c(“#00AFBB”, “#E7B800”, “#FC4E07”,391),
labels = c(“Metal(Gold,Silver,etc)”, “Cosmetics”,”Electronic Items”,”Home Appliances”),
name = “Commodity”) +
labs(title=”Plotting Age versus Commodity”,x=”Age”,y=”Commodity”) +
theme(legend.background = element_rect(fill=”gray90″)) + theme_pubclean()
#Online Shoppers and thier problems
ggplot(my_input, aes(x= what_problem, group=online_shopping)) +
geom_bar(aes(y = ..prop.., fill = factor(..x..))) +
geom_text(aes( label = scales::percent(..prop..),
y= ..prop.. ), stat= “count”, vjust = -.5) +
labs(y = “Percentage”, fill=”what_problem”) +
facet_grid(~online_shopping) +
scale_y_continuous(labels = scales::percent) +
theme_pubclean() +
scale_fill_manual(values = c(“#00AFBB”, “#E7B800”, “#FC4E07”,391,78,87),labels = c(“No Problem”,”Delay in Delivery”,”Cheap Quality of Product”,”Product Damage”,”Non-Delivery”,”Payment Problem”)) +
labs(title=”Online Shoppers and thier problems”,x=”Problem in Online Shopping”,y=”Percentage”,face=”bold”) +
theme(legend.title = element_text(face=”bold”),legend.background = element_rect(fill=”darkgrey”))
#Age Versus Salary
as<-ggplot(my_input,aes(x=age,y=income)) + geom_bar(color=”red”,fill=”yellow”,stat = “identity”) + scale_fill_grey() + theme(legend.position = “none”) +
labs(title=”Age Versus Salary”,x=”Age”,y=”Income”) + theme_pubclean()
ggplotly(as)
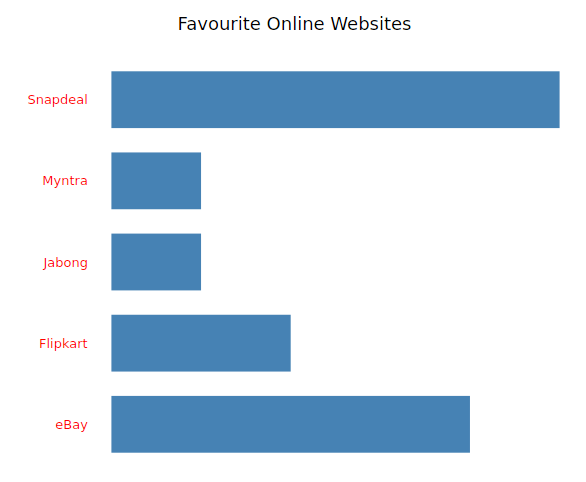
#Favourite Online Shopping Websites
fav<-ggplot(my_input,aes(x=favourite)) + geom_bar(fill=”steelblue”,width = 0.70) + coord_flip() + theme_light() +
theme(panel.grid = element_blank(),
panel.border = element_blank(),
axis.title = element_blank(),
axis.ticks = element_blank(),
axis.text.x = element_blank(),
axis.text.y = element_text(color =”red”,face = “bold”,size = 10)) +
labs(title=”Favourite Online Websites”)
ggplotly(fav)
#Finding the best Clustering algorithm for our data
#install.packages(“clValid”)
library(clValid)
#Internal Validation Measures
#Compute clValid
clmethods<-c(“hierarchical”,”kmeans”,”pam”)
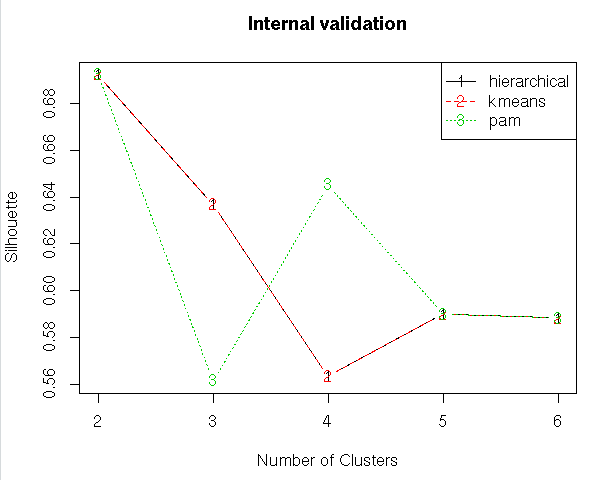
intern<-clValid(my_input[,c(3:15)], nClust = 2:6,
clMethods = clmethods, validation = “internal”)
str(my_input[,c(3:15)])
# Summary
summary(intern)
#Ploting the summary
plot(intern)
#Stability Validation Measures
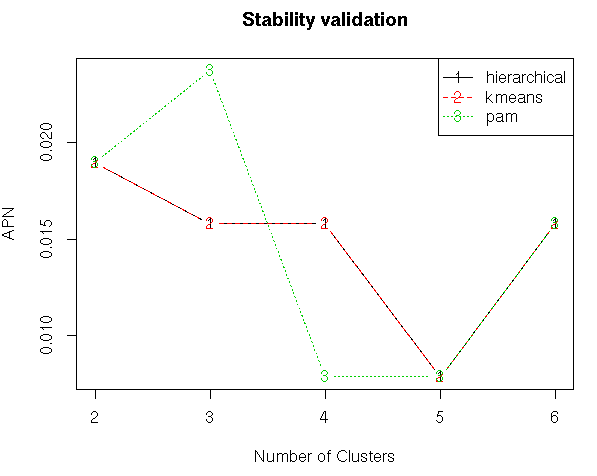
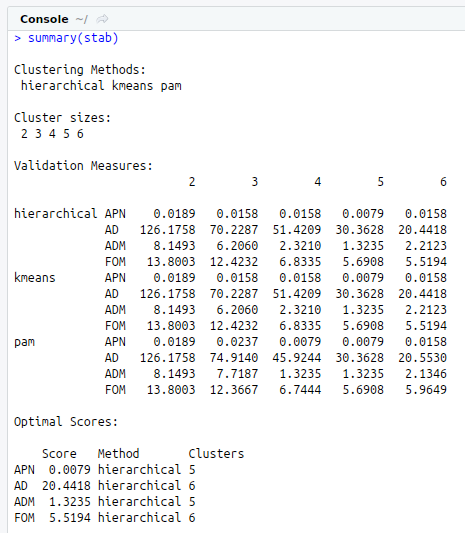
stab<-clValid(my_input[,c(3:15)],nClust=2:6,clMethods = clmethods,validation = “stability”)
#Summary
summary(stab)
#Plotting the summary
plot(stab)
#Hierarchical Clustering
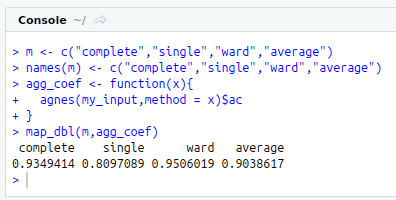
#Finding the more appropriate method for more strongest clustering structure
#install.packages(“purrr”)
library(“purrr”)
m<-c(“complete”,”single”,”ward”,”average”)
names(m)<-c(“complete”,”single”,”ward”,”average”)
agg_coef<-function(x){
agnes(my_input[,3:15],method = x)$ac
}
map_dbl(m,agg_coef)
#Compute hclust
h_dist<-dist(my_input[,3:15],method = “euclidean”)
h_data<-hclust(h_dist, method = “ward.D”)
#Plotting Dendrogram
plot(h_data)
rect.hclust(h_data,k=2)
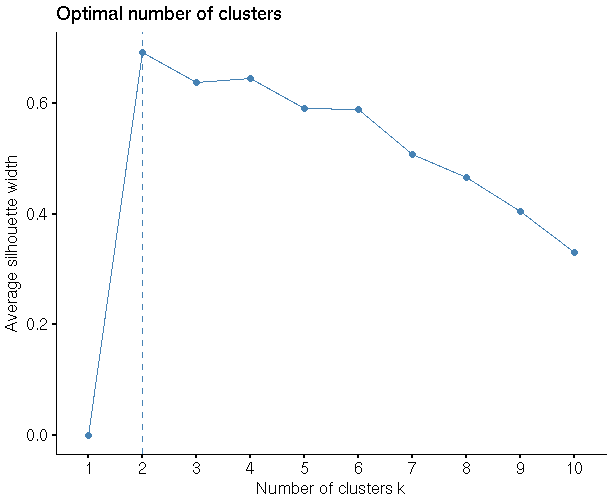
#Finding the optimal No of clusters
library(“factoextra”)
fviz_nbclust(my_input,hcut,method = “silhouette”)
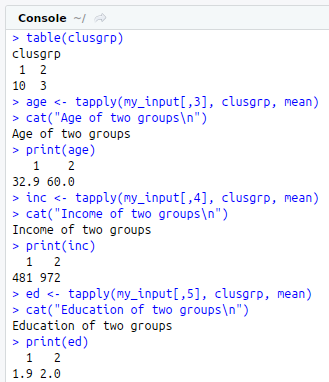
clusgrp<-cutree(h_data,k=2)
table(clusgrp)
age<-tapply(my_input[,3], clusgrp, mean)
cat(“Age of two groups\n”)
print(age)
inc<-tapply(my_input[,4], clusgrp, mean)
cat(“Income of two groups\n”)
print(inc)
ed<-tapply(my_input[,5], clusgrp, mean)
cat(“Education of two groups\n”)
print(ed)
mode<-function(f){
uni<-unique(f)
uni[which.max(tabulate(match(f,uni)))]
}
onshop<-tapply(my_input[,6], clusgrp, mode)
cat(“Online Shopping of two groups\n”)
print(onshop)
save<-tapply(my_input$save_time, clusgrp, mode)
cat(“Shopping on Internet saves time”)
print(save)
any_time<-tapply(my_input$any_time, clusgrp, mode)
cat(“It is a great advantage to be able to shop at any time of the day”)
print(any_time)
traditional<-tapply(my_input$traditional_online, clusgrp, mode)
cat(“I prefer traditional shopping to online shopping”)
print(traditional)
credit<-tapply(my_input$credit_card, clusgrp, mode)
cat(“While shopping online I hesitate to give my credit card number”)
print(credit)
cash<-tapply(my_input$cash_on_delivery, clusgrp, mode)
cat(“I cash on delivery than payment via credit/debit card”)
print(cash)
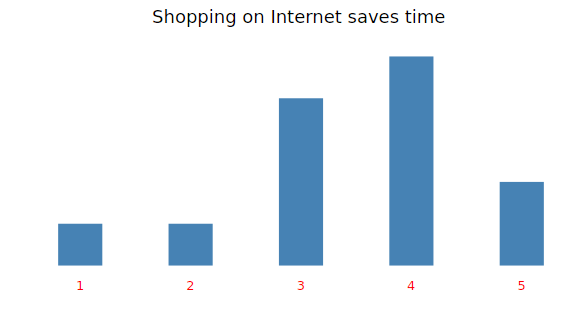
#Bar chart of “Shopping on Internet saves time”
fav<-ggplot(my_input,aes(x=as.factor(save_time))) + geom_bar(fill=”steelblue”,width = 0.40)+ theme_light() +
theme(panel.grid = element_blank(),
panel.border = element_blank(),
axis.title = element_blank(),
axis.ticks = element_blank(),
axis.text.y = element_blank(),
axis.text.x = element_text(color =”red”,face = “bold”,size = 10)) +
labs(title=”Shopping on Internet saves time”)
ggplotly(fav)
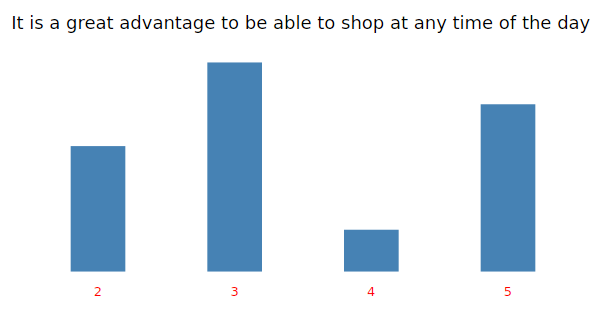
#Bar chart of “It is a great advantage to be able to shop at any time of the day”
fav<-ggplot(my_input,aes(x=as.factor(any_time))) + geom_bar(fill=”steelblue”,width = 0.40)+ theme_light() +
theme(panel.grid = element_blank(),
panel.border = element_blank(),
axis.title = element_blank(),
axis.ticks = element_blank(),
axis.text.y = element_blank(),
axis.text.x = element_text(color =”red”,face = “bold”,size = 10)) +
labs(title=”It is a great advantage to be able to shop at any time of the day”)
ggplotly(fav)
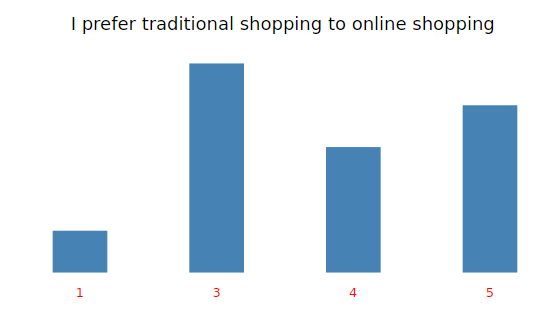
#Bar chart of “I prefer traditional shopping to online shopping”
fav<-ggplot(my_input,aes(x=as.factor(traditional_online))) + geom_bar(fill=”steelblue”,width = 0.40)+ theme_light() +
theme(panel.grid = element_blank(),
panel.border = element_blank(),
axis.title = element_blank(),
axis.ticks = element_blank(),
axis.text.y = element_blank(),
axis.text.x = element_text(color =”red”,face = “bold”,size = 10)) +
labs(title=”I prefer traditional shopping to online shopping”)
ggplotly(fav)
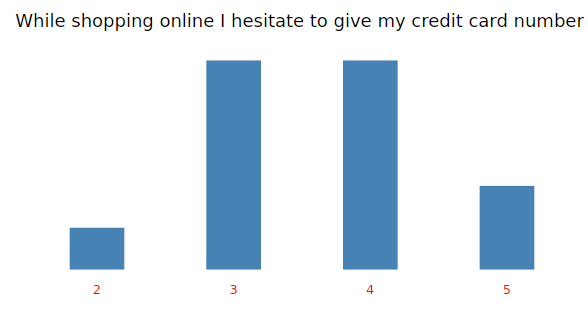
#Bar chart of “While shopping online I hesitate to give my credit card number”
fav<-ggplot(my_input,aes(x=as.factor(credit_card))) + geom_bar(fill=”steelblue”,width = 0.40)+ theme_light() +
theme(panel.grid = element_blank(),
panel.border = element_blank(),
axis.title = element_blank(),
axis.ticks = element_blank(),
axis.text.y = element_blank(),
axis.text.x = element_text(color =”red”,face = “bold”,size = 10)) +
labs(title=”While shopping online I hesitate to give my credit card number”)
ggplotly(fav)
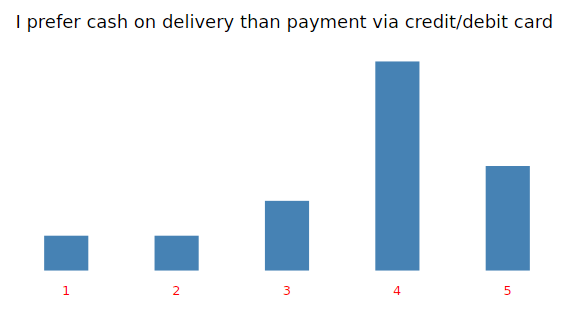
#Bar chart of “I prefer cash on delivery than payment via credit/debit card”
fav<-ggplot(my_input,aes(x=as.factor(cash_on_delivery)))+ geom_bar(fill=”steelblue”,width = 0.40)+ theme_light() +
theme(panel.grid = element_blank(),
panel.border = element_blank(),
axis.title = element_blank(),
axis.ticks = element_blank(),
axis.text.y = element_blank(),
axis.text.x = element_text(color =”red”,face = “bold”,size = 10)) +
labs(title=”I prefer cash on delivery than payment via credit/debit card”)
ggplotly(fav)
