-
Step 1 — Update System and Install Dependencies
Update system:
sudo apt update
Install required dependencies:
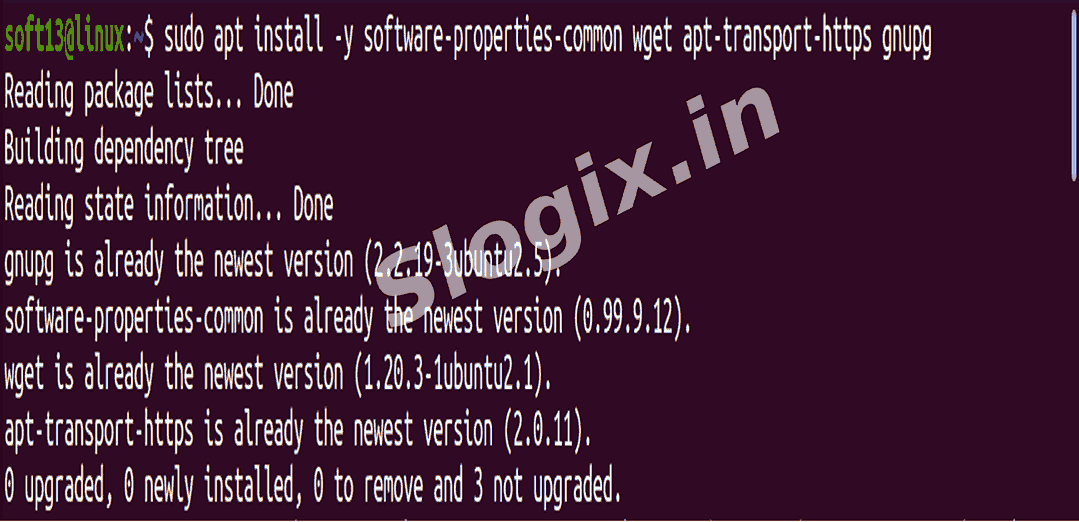
sudo apt install -y software-properties-common wget apt-transport-https gnupg
software-properties-common → allows adding repositories
wget → for downloading files
apt-transport-https → allows HTTPS repositories
gnupg → for GPG key verification
-
Step 2 — Add Grafana GPG Key
Add Grafana GPG key:
wget -q -O - https://packages.grafana.com/gpg.key | sudo gpg --dearmor -o /usr/share/keyrings/grafana-archive-keyring.gpg
Ensures APT trusts the Grafana repository.
-
Step 3 — Add Grafana APT Repository
Add Grafana OSS repository:
echo "deb [signed-by=/usr/share/keyrings/grafana-archive-keyring.gpg] https://packages.grafana.com/oss/deb stable main" | sudo tee /etc/apt/sources.list.d/grafana.list
Points APT to the official Grafana OSS repository.
-
Step 4 — Update Package List
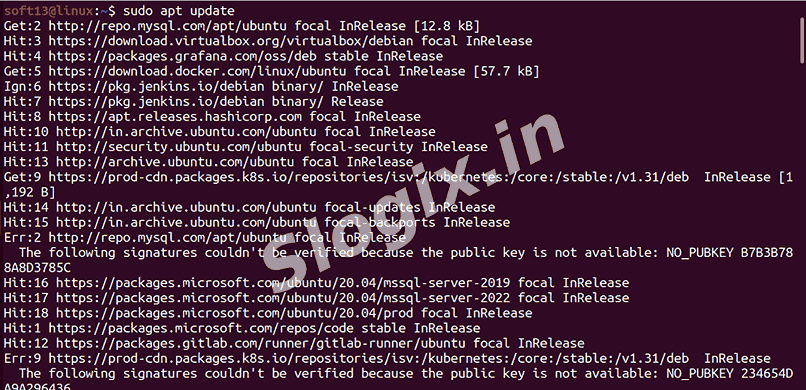
Update package list:
sudo apt update
Now the grafana package is available.
-
Step 5 — Install Grafana
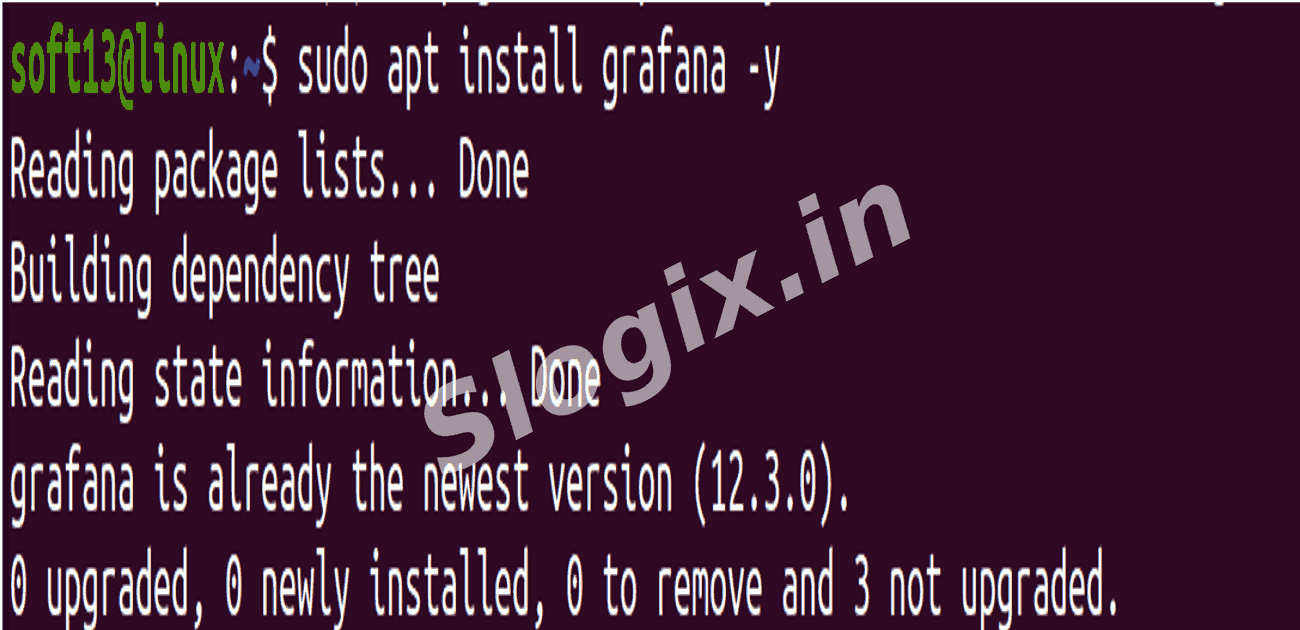
Install Grafana:
sudo apt install grafana -y
Installs Grafana server and CLI tools.
-
Step 6 — Start and Enable Grafana Service
Start and enable Grafana:
sudo systemctl start grafana-server
sudo systemctl enable grafana-server
sudo systemctl status grafana-server
Starts Grafana service and ensures it runs on boot.
Default Grafana port: 3000
-
Step 7 — Find Server IP
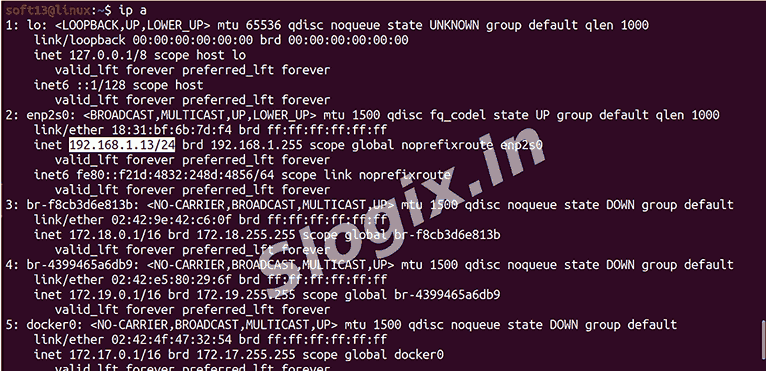
Check IP address:
ip a
Look for inet <IP_ADDRESS> under your active network interface.
Example: 192.168.1.50
-
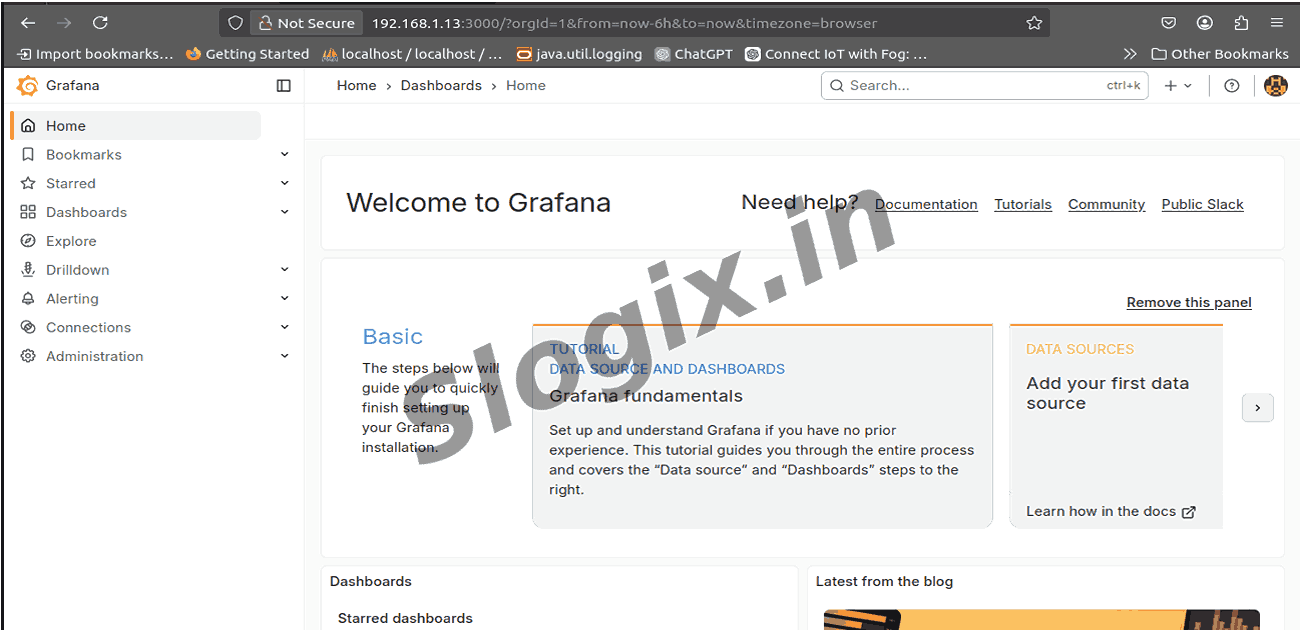
Step 8 — Open Grafana in Browser
Local machine:
http://localhost:3000
Remote server:
http://<server-ip>:3000
-
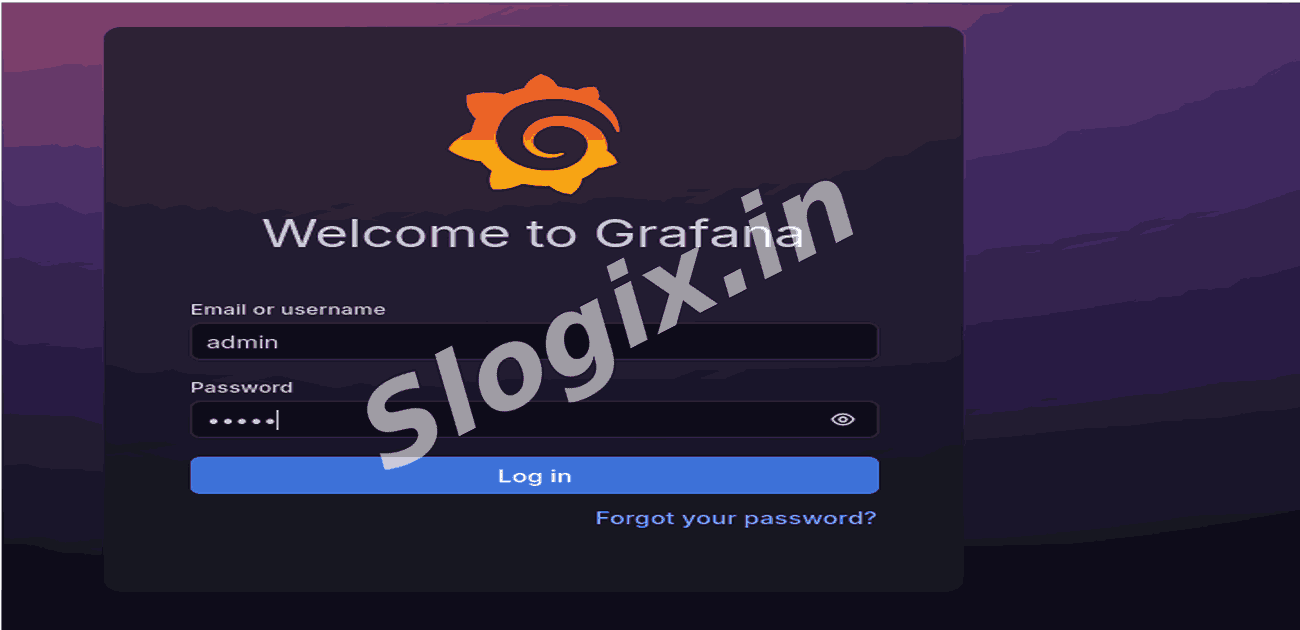
Step 9 — Login
Username: admin
Password: admin(Grafana@123) → you will be prompted to change it on first login.
 Research Breakthrough Possible @S-Logix