-
Prelim — Fix package manager problems
If you see errors while installing packages, run:
# resume interrupted configuration
sudo dpkg --configure -a

# fix broken dependencies
sudo apt install -f -y
Repeat sudo apt update after these succeed.
-
Step 1 — Install Node Exporter (target server you want to monitor)
Update packages:
sudo apt update
Install Node Exporter from distro repo:
sudo apt install prometheus-node-exporter -y
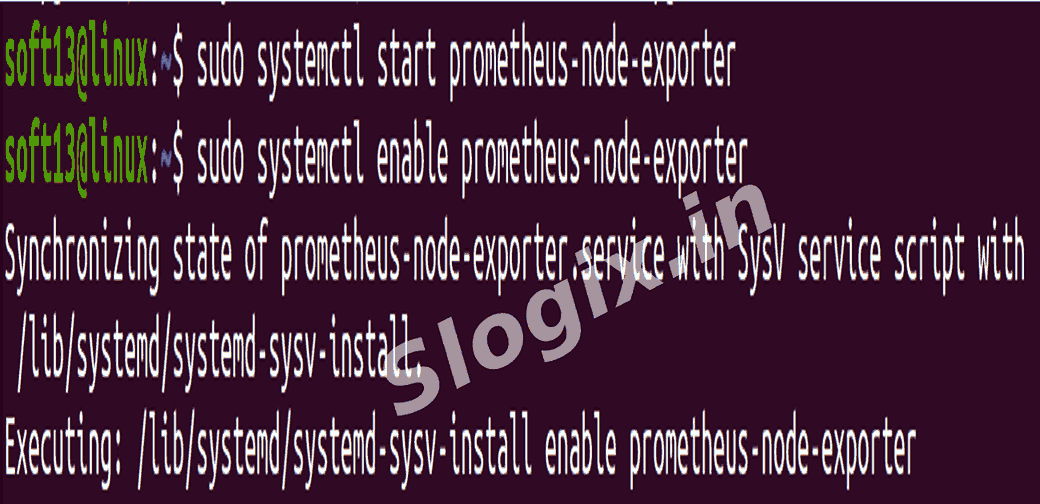
Start & enable the service:
sudo systemctl start prometheus-node-exporter
sudo systemctl enable prometheus-node-exporter
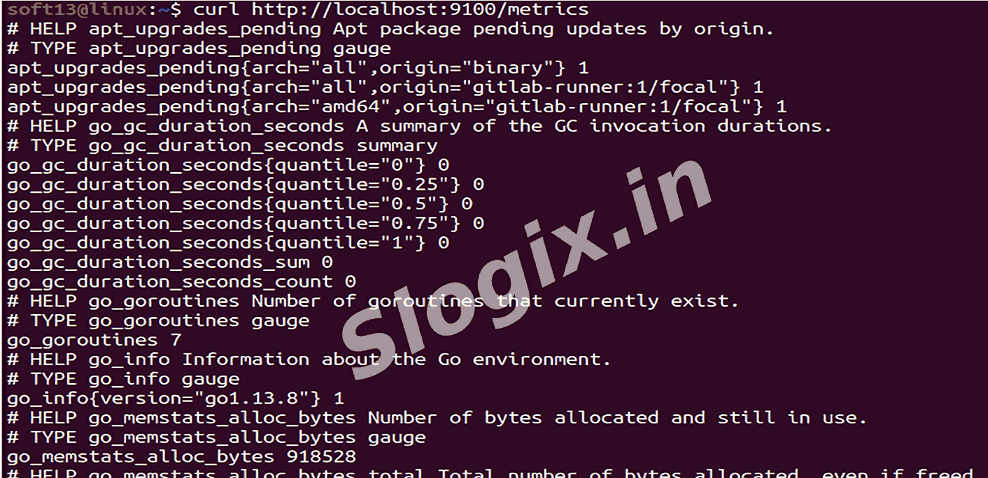
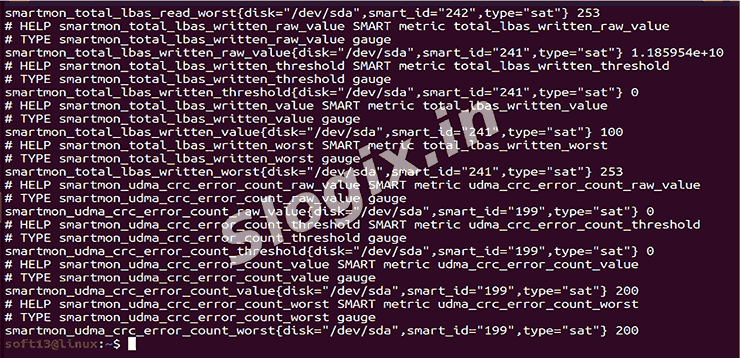
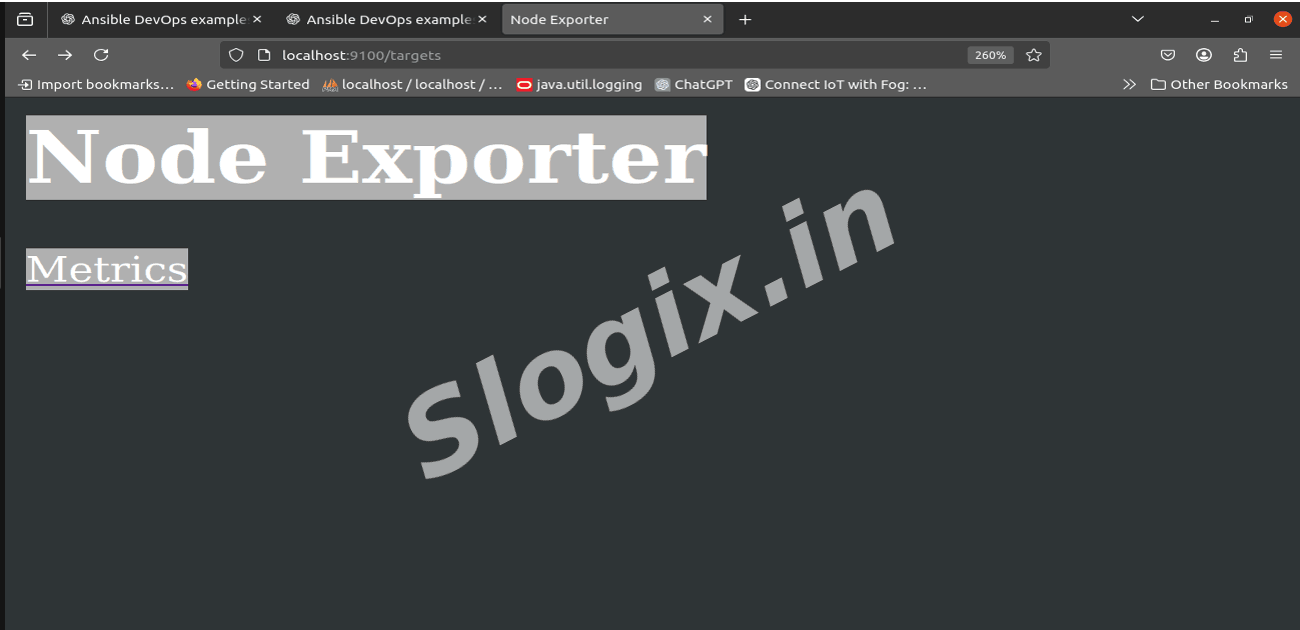
Verify it is serving metrics:
curl http://localhost:9100/metrics
You should see many metric lines (e.g., node_cpu_seconds_total, node_memory_MemAvailable_bytes).
-
Step 2 — Install Prometheus (the monitoring server)
On the machine that will run Prometheus, update packages:
sudo apt update
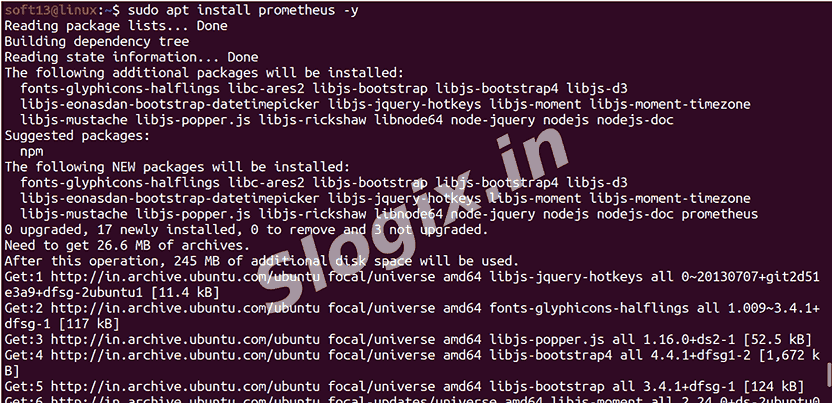
Install Prometheus:
sudo apt install prometheus -y
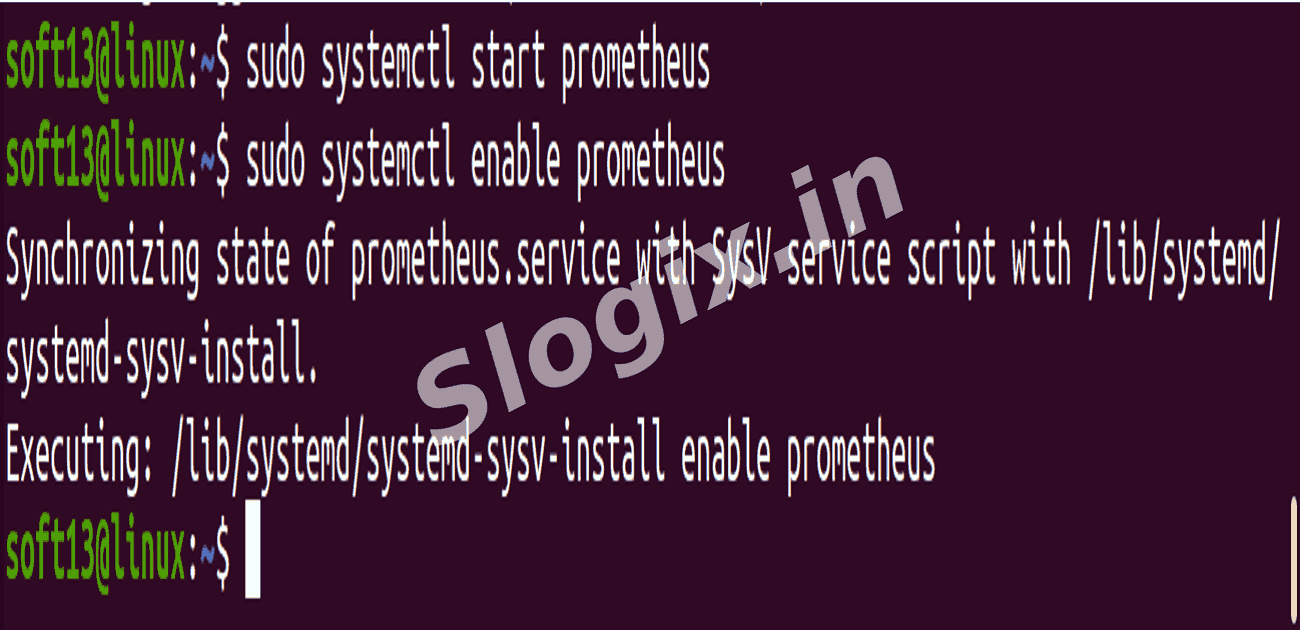
Start & enable Prometheus:
sudo systemctl start prometheus
sudo systemctl enable prometheus
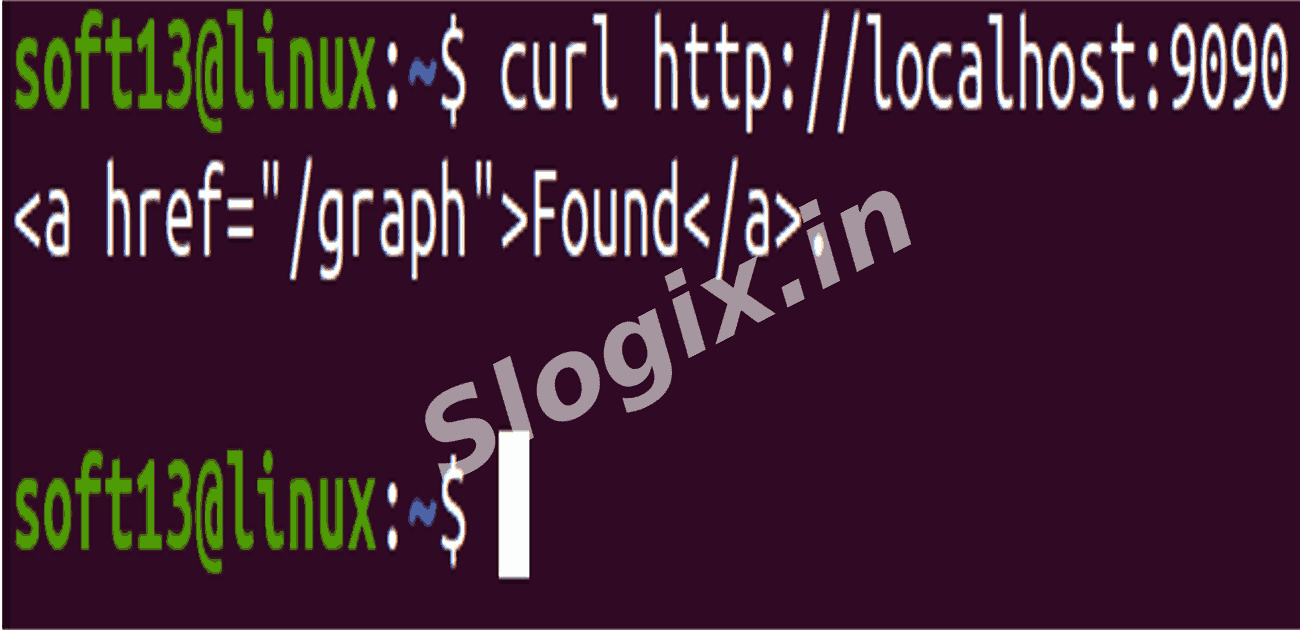
Quick check:
curl http://localhost:9090
The Prometheus UI should be available at:
http://<prometheus-server-ip>:9090
-
Step 3 — Configure Prometheus to scrape Node Exporter
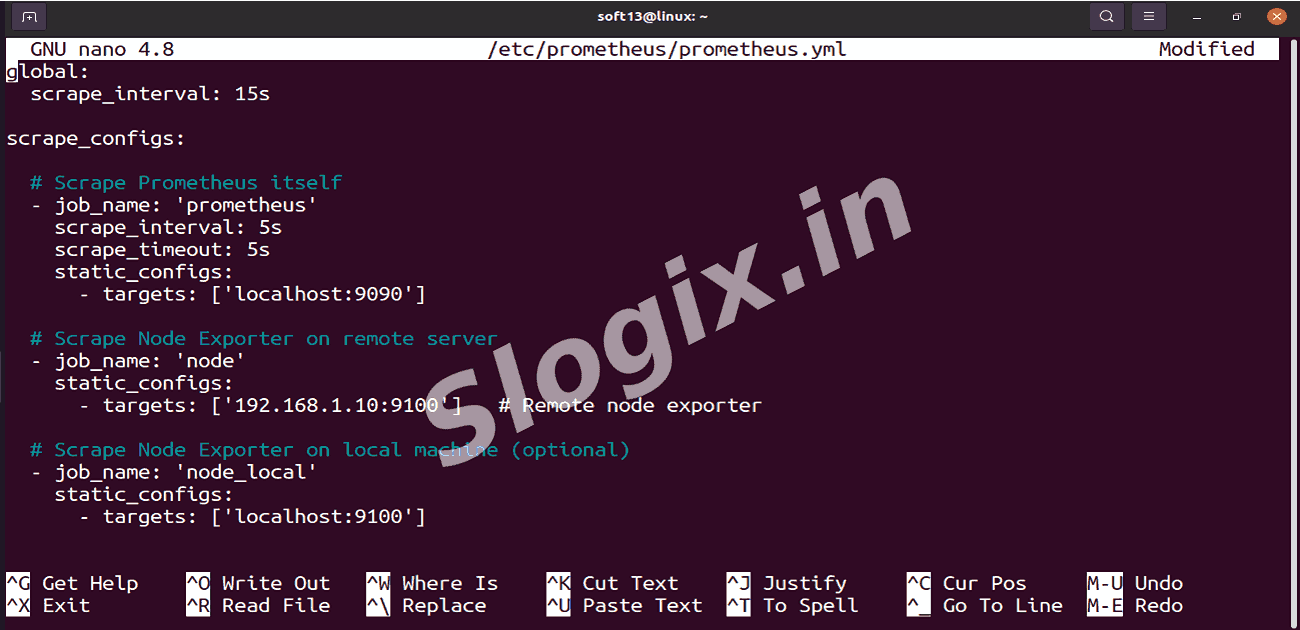
Edit Prometheus config:
sudo nano /etc/prometheus/prometheus.yml
Replace or update with the following content (adjust IPs as needed):
global:
  scrape_interval: 15s

scrape_configs:

  # Prometheus itself
  - job_name: 'prometheus'
    scrape_interval: 5s
    scrape_timeout: 5s
    static_configs:
      - targets: ['localhost:9090']

  # Remote Node Exporter
  - job_name: 'node'
    static_configs:
      - targets: ['192.168.1.10:9100']   # <-- change to your monitored server IP

  # Optional: local node exporter (if present)
  - job_name: 'node_local'
    static_configs:
      - targets: ['localhost:9100']
Restart Prometheus to apply changes:
sudo systemctl restart prometheus
-
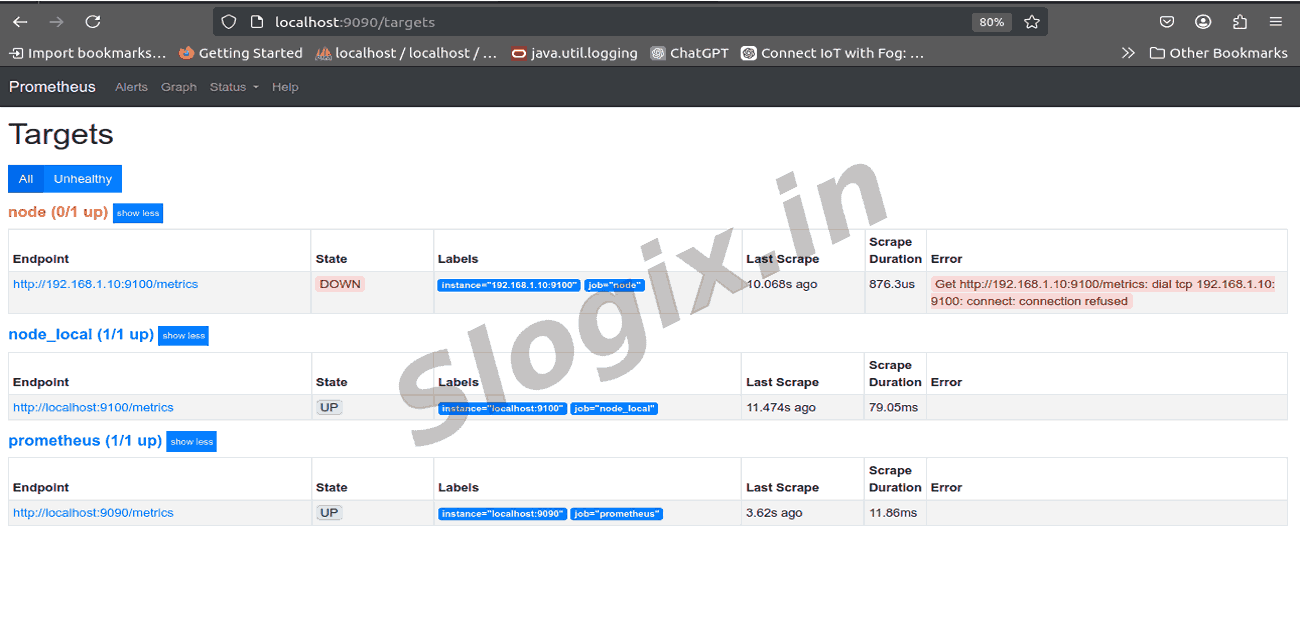
Step 4 — Verify scraping and targets
Open Prometheus UI:
http://<prometheus-server-ip>:9090
Check targets page:
http://<prometheus-server-ip>:9090/targets
You should see node:9100 (or 192.168.1.10:9100) in UP state.
If node target is DOWN, check:
# On target host
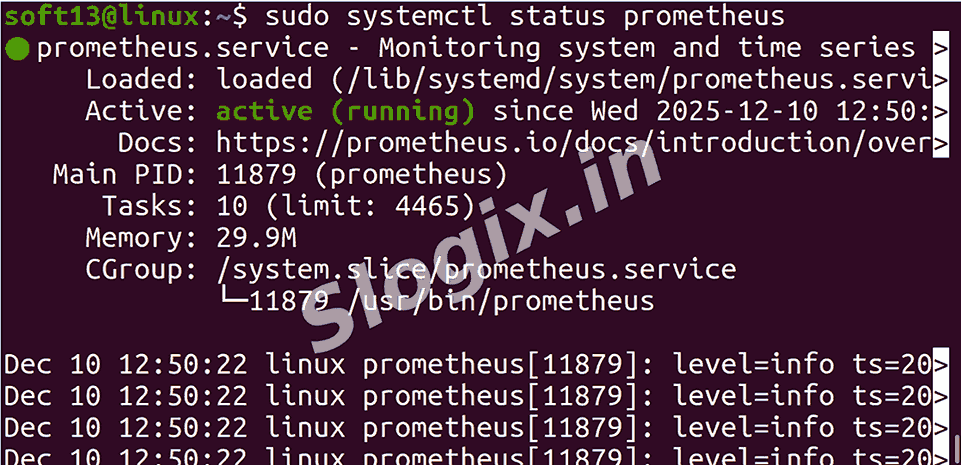
sudo systemctl status prometheus-node-exporter
# Firewall / connectivity
telnet 192.168.1.10 9100
ss -ltn
iptables / ufw rules
# On Prometheus host
sudo journalctl -u prometheus -e
 Research Breakthrough Possible @S-Logix