How to Build a Deep Neural Network (DNN) Model for Predicting Student Health Risk Levels Using Health Data
Share
Condition for Building a Deep Neural Network (DNN) Model for Predicting Student Health Risk Levels Using Health Data
Description:
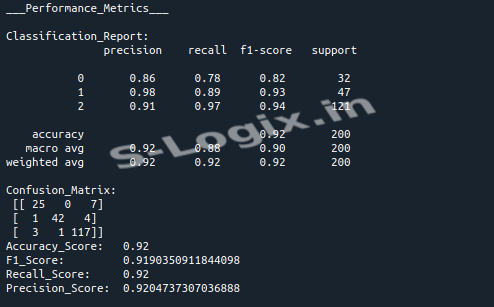
The code performs data preprocessing, including handling missing values, encoding categorical variables, and scaling the features. It then defines, trains, and evaluates a deep neural network (DNN) model to predict students' health risk levels based on various features. Finally, it evaluates model performance using metrics like accuracy, F1-score, and visualizes the confusion matrix.
Step-by-Step Process
Import Libraries:
Import necessary libraries like pandas, numpy, sklearn, and Keras for data manipulation and machine learning model creation.
Load and Inspect Data:
Load the student health dataset and examine health risk levels and other features.
Check Missing Data:
Check for missing or NaN values in the dataset and handle them accordingly.
Data Visualization:
Visualize the distribution of health risk levels in the dataset using a pie chart.
Preprocess Data:
Split the dataset into features and target variables, encode categorical variables, and standardize the data.
Build and Train Model:
Define a deep neural network (DNN) model and train it using the training data.
Evaluate Model:
Evaluate the model using test data, calculate performance metrics, and visualize the confusion matrix.
Sample Source Code
# Import Necessary Libraries
import pandas as pd
import numpy as np
import matplotlib.pyplot as plt
import seaborn as sns
import warnings
warnings.filterwarnings("ignore")
from sklearn.preprocessing import StandardScaler, LabelEncoder
from sklearn.model_selection import train_test_split
from tensorflow.keras.models import Model
from tensorflow.keras.layers import Input, Dense
from sklearn.metrics import (classification_report, confusion_matrix, accuracy_score,
f1_score, recall_score, precision_score)
# Check for null values
print("check null values\n")
print(df.isnull().sum())
# Check for NaN values
print("Check NaN Values\n")
print(df.isna().sum())
# Data visualization
class_counts = df['Health_Risk_Level'].value_counts()
plt.figure(figsize=(6, 6))
plt.pie(class_counts, labels=class_counts.index, autopct='%1.1f%%', startangle=90, colors=sns.color_palette('Set3', len(class_counts)))
plt.title('Class Distribution in Training Data')
plt.show()
# Split the data
x = df.drop('Health_Risk_Level',axis=1)
y = df['Health_Risk_Level']
label = LabelEncoder()
y = label.fit_transform(y)
for i in x.columns:
dtype = df[i].dtypes
if dtype == object:
x[i] = label.fit_transform(x[i])
scaler = StandardScaler()
x = scaler.fit_transform(x)
 Research Breakthrough Possible @S-Logix