How to Build and Evaluate a Deep Neural Network Model for Car Price Prediction in Python?
Share
Condition for Building and Evaluating a Deep Neural Network Model for Car Price Prediction
Description: This code demonstrates a pipeline for predicting car prices using a Deep Neural Network (DNN). It involves preprocessing a dataset (handling missing values, encoding categorical data, and scaling features), building a regression model with TensorFlow/Keras, and evaluating its performance using metrics like MAE, MSE, RMSE, and R². The approach integrates data visualization and correlation analysis to enhance model understanding.
Step-by-Step Process
Import Libraries: Import essential libraries like pandas, numpy, sklearn, and TensorFlow to handle data processing, visualization, and building a regression model.
Load and Inspect Data: Load the car dataset using pd.read_csv() to enable data analysis and model training.
Check for Missing Values: Check for null or NaN values to ensure clean data before proceeding.
Preprocess Data: Encode categorical columns and scale features to prepare the data for model training.
Build and Train Model: Define and train a custom Deep Neural Network model with Keras, optimized for regression.
Evaluate Model Performance: Evaluate the model's performance using MAE, MSE, RMSE, and R² metrics to assess accuracy.
Sample Source Code
#Import Necessary Libraries
import pandas as pd
import numpy as np
from sklearn.preprocessing import LabelEncoder, StandardScaler, MinMaxScaler
import matplotlib.pyplot as plt
import seaborn as sns
from sklearn.model_selection import train_test_split
from tensorflow.keras.layers import Dense, Input
from tensorflow.keras.models import Model
import warnings
warnings.filterwarnings("ignore")
from sklearn.metrics import mean_absolute_error, mean_squared_error, r2_score
x = df.drop('price',axis=1)
y = df['price']
y = np.array(y).reshape(-1,1)
#Scaling the Data
scaler = StandardScaler()
x = scaler.fit_transform(x)
scale = MinMaxScaler()
y = scale.fit_transform(y)
y = y.reshape(y.shape[0])
#Split the Training and Testing Set
X_train,X_test,y_train,y_test = train_test_split(x,y,test_size=.2,random_state=42)
def DNN_model(input_shape):
# Input layer
inputs = Input(shape=(input_shape,))
# Hidden layers
layer1 = Dense(32, activation='relu')(inputs)
layer2 = Dense(16, activation='relu')(layer1)
# Output layer
output_layer = Dense(1, activation='linear')(layer2)
# Build the model
ann_model = Model(inputs=inputs, outputs=output_layer)
# Compile the model with Adam optimizer and binary crossentropy loss function
ann_model.compile(optimizer='adam', loss='mean_squared_error', metrics=['mse'])
return ann_model
model = DNN_model(X_train.shape[1])
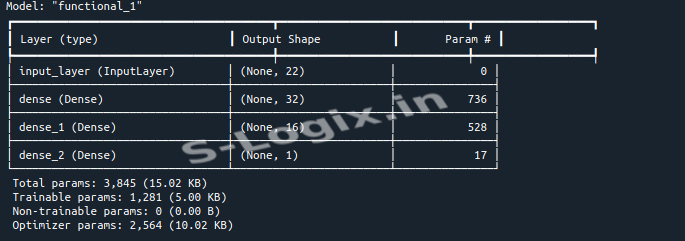
#Summary of Model
model.summary()
model.fit(X_train,y_train,batch_size=2,epochs=10,validation_data=(X_test,y_test))
y_pred = model.predict(X_test)
# Calculate MAE, MSE, RMSE, R2, and MAPE
mae = mean_absolute_error(y_test, y_pred)
mse = mean_squared_error(y_test, y_pred)
rmse = np.sqrt(mse)
r2 = r2_score(y_test, y_pred)
# Print the metrics
print("___Performance_Metrics___\n")
print("Mean Absolute Error (MAE): ", mae)
print("Mean Squared Error (MSE): ", mse)
print("Root Mean Squared Error (RMSE): ", rmse)
print("R-squared (R²): ", r2)
 Research Breakthrough Possible @S-Logix