How to Build a GRU-Based Model for Stock Price Prediction Using Yahoo Finance Data
Share
Condition for Building a GRU-Based Model for Stock Price Prediction Using Yahoo Finance Data
Description: This code implements a binary image classification model using MobileNetV2 for classifying cat and dog images. It utilizes transfer learning by freezing the pre-trained layers of MobileNetV2 and adding custom dense layers for classification. The model is trained on the processed images, evaluated with performance metrics, and visualized with a confusion matrix.
Step-by-Step Process
Import Libraries: Import essential libraries like numpy, tensorflow, PIL, and sklearn for image processing and model building.
Load and Inspect Images: Load cat and dog images from directories, and visualize samples for inspection.
Preprocess Data: Resize images to 224x224 pixels, normalize pixel values, and encode labels.
Build and Train Model: Use MobileNetV2 as the base model, freeze pre-trained layers, and add custom dense layers for classification.
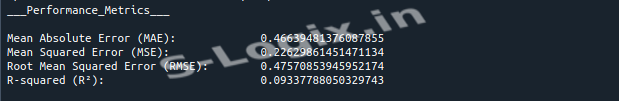
Evaluate and Visualize: Evaluate the model using test data, calculate performance metrics, and plot a confusion matrix.
Sample Source Code
# Import Necessary Libraries
import pandas as pd
import matplotlib.pyplot as plt
import seaborn as sns
from sklearn.preprocessing import StandardScaler
from sklearn.model_selection import train_test_split
import warnings
warnings.filterwarnings("ignore")
from tensorflow.keras.layers import Input, GRU, Dense
from tensorflow.keras.models import Model
from sklearn.metrics import mean_absolute_error, mean_squared_error, r2_score
import numpy as np
# Scaling the input data
scaler = StandardScaler()
x = scaler.fit_transform(x)
# Split the train_test_data
X_train, X_test, y_train, y_test = train_test_split(x,y,test_size=.2,random_state=42)
# Reshape the Data for LSTM model
X_train_reshaped = X_train.reshape(X_train.shape[0],1,X_train.shape[1])
X_test_reshaped = X_test.reshape(X_test.shape[0],1,X_test.shape[1])
# Build the model
gru_model = Model(inputs=inputs, outputs=output_layer)
# Compile the model with Adam optimizer and mean squared error loss function
gru_model.compile(optimizer='adam', loss='mean_squared_error', metrics=['mean_absolute_error'])
return gru_model
model = GRU_model((X_train_reshaped.shape[1],X_train_reshaped.shape[2]))
 Research Breakthrough Possible @S-Logix