How to Predict Breast Cancer Using Support Vector Machine in Python?
Share
Condition for Predicting Breast Cancer Using Support Vector Machine (SVM)
Description: Breast cancer is one of the most common types of cancer worldwide. Early detection and diagnosis of breast cancer are crucial for effective treatment and management. Machine learning algorithms, such as Support Vector Machines (SVM), can be used to predict the presence of breast cancer based on various medical features. In this project, we will explain how to predict breast cancer using the SVM algorithm, demonstrating the process with a dataset other than the Iris or Wine datasets.
Why Should We Choose Support Vector Machine (SVM)?
High-Dimensional Data Handling: SVM can effectively handle high-dimensional data, making it suitable for medical data classification.
Clear Margin of Separation: SVM creates a clear margin of separation between classes, improving classification accuracy.
Non-linear Data Classification: With kernel tricks like the Radial Basis Function (RBF), SVM performs well with non-linearly separable data.
Robust to Overfitting: SVM is robust to overfitting, especially in high-dimensional spaces, making it effective for medical datasets.
Step-by-Step Process
Data Preprocessing: Load the dataset, inspect it for missing or irrelevant data, and clean the data if necessary. Split the data into training and testing sets, and scale it using standardization techniques.
Model Training: Train an SVM classifier using a suitable kernel (e.g., RBF) on the training data. Tune hyperparameters such as C and gamma.
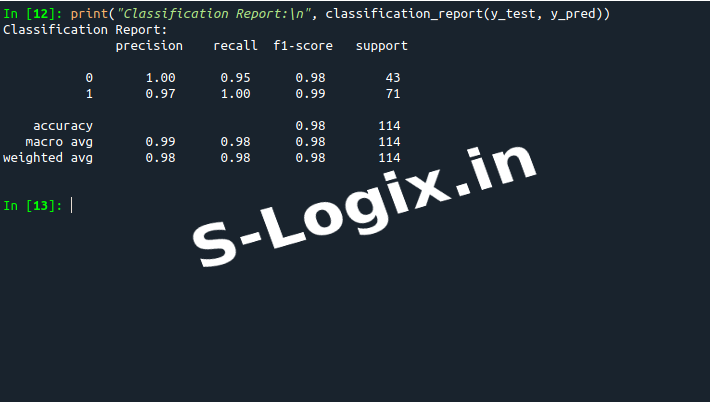
Model Evaluation: Evaluate the model on the testing set using performance metrics like accuracy, precision, recall, and F1-score. Use the confusion matrix to assess the model's performance further.
Visualization: Visualize the decision boundaries, ROC curve, and confusion matrix to better understand the model's performance.
Sample Source Code
import numpy as np
import pandas as pd
import matplotlib.pyplot as plt
from sklearn.model_selection import train_test_split
from sklearn.preprocessing import StandardScaler
from sklearn.svm import SVC
from sklearn.metrics import classification_report, confusion_matrix, roc_curve, auc
from sklearn.datasets import load_breast_cancer
# Load Breast Cancer Dataset
data = load_breast_cancer()
X = data.data # Features
y = data.target # Labels (0 = Malignant, 1 = Benign)
# Convert to DataFrame for easier exploration
df = pd.DataFrame(X, columns=data.feature_names)
df['label'] = y
 Research Breakthrough Possible @S-Logix