Condition for Open CloudWatch and View EC2 Metrics
Description: CloudWatch automatically collects several key metrics from every EC2 instance, including CPU utilization, network traffic, and disk operations. By exploring these metrics, to gain visibility into system performance and can make informed decisions related to scaling, troubleshooting, and resource optimization. This activity helps the understand how AWS monitoring works and prepare for real-world operations and DevOps tasks.
Steps
Step 1: Open CloudWatch Console
Go to : AWS Console → CloudWatch
Step 2: Navigate to Metrics
Left side menu : Metrics → EC2
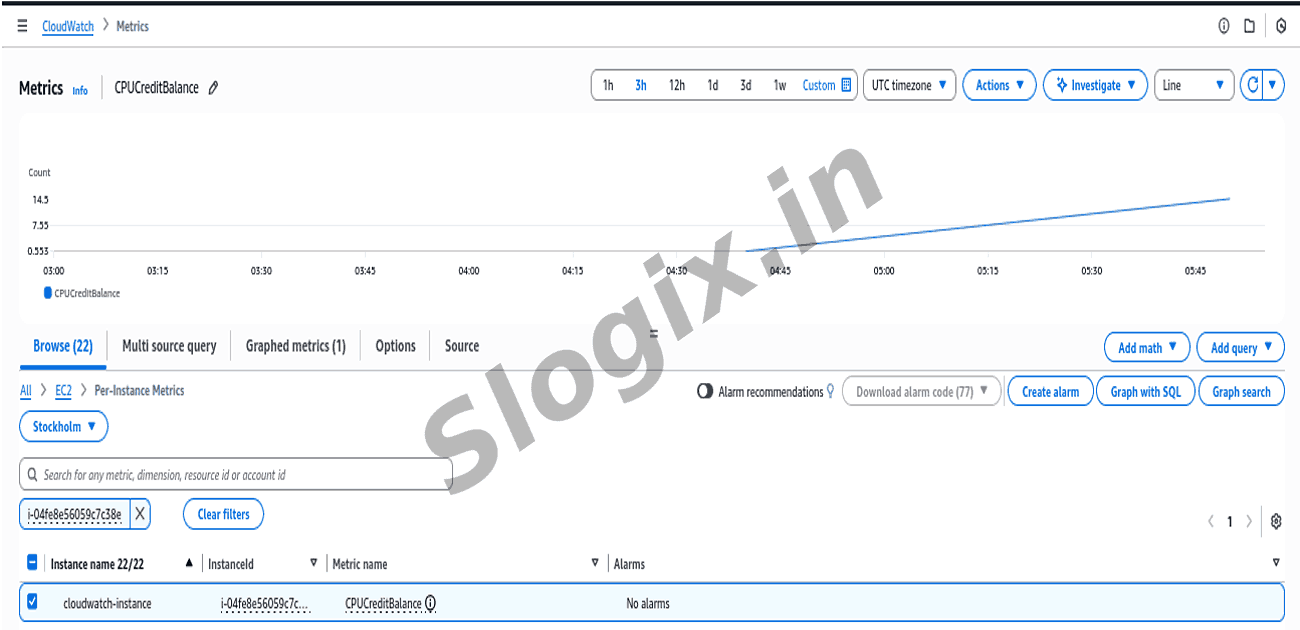
Step 3: Select “Per-Instance Metrics”
Per-Instance Metrics
By Auto Scaling Group
By Image
By Instance Type
Click : EC2 → Per-Instance Metrics
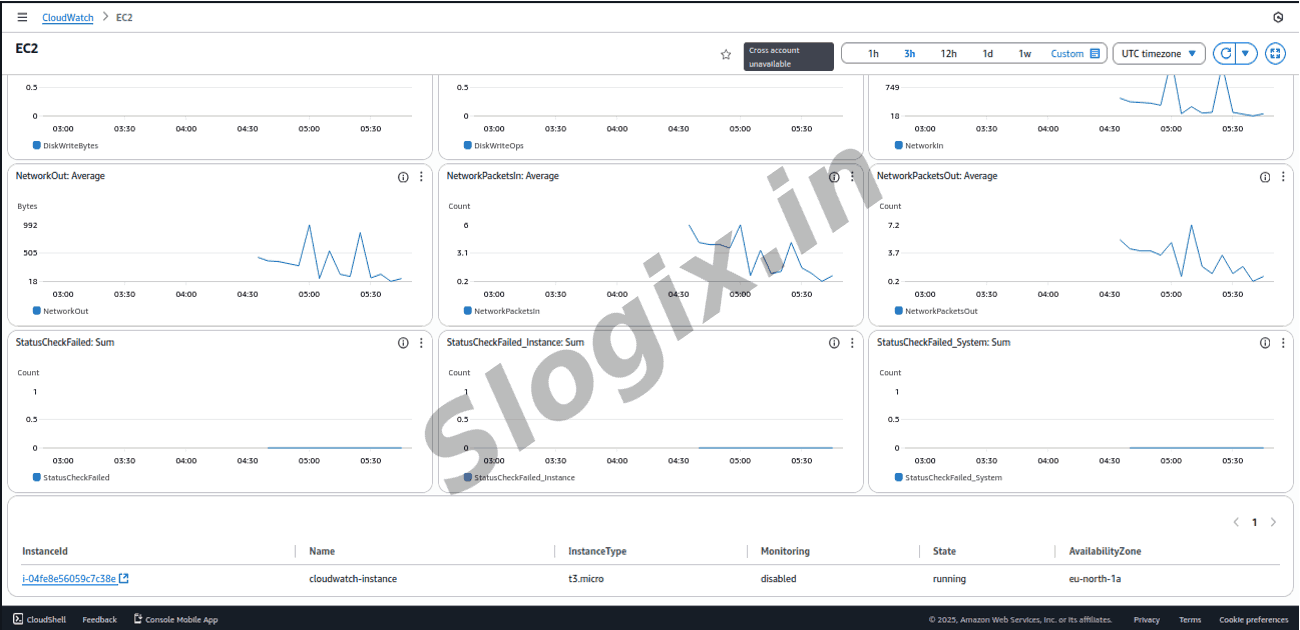
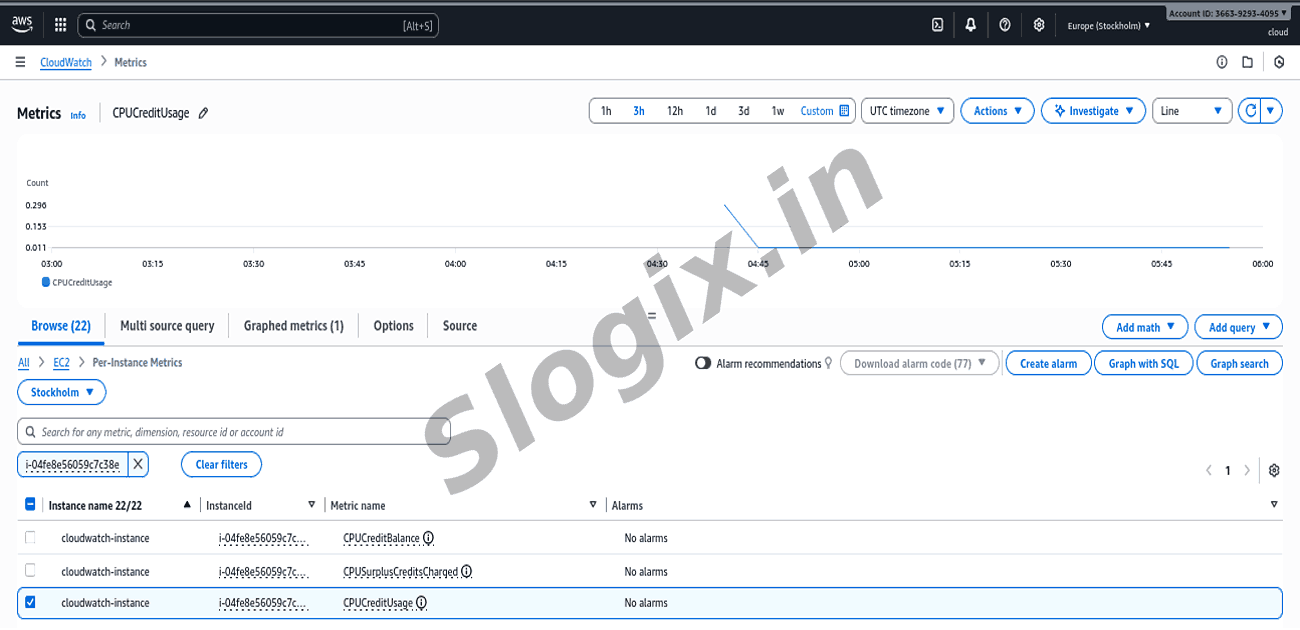
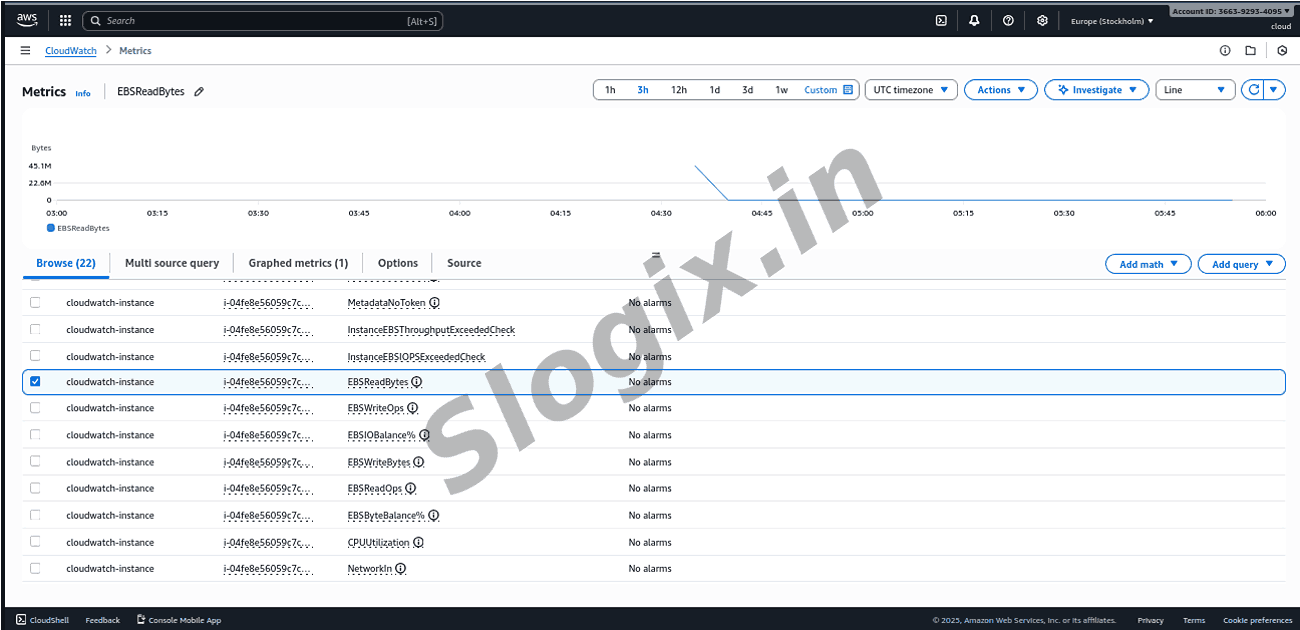
Step 4: The EC2 instance under evaluation
From the list:
Find the Instance ID
Click on it to view all available metrics
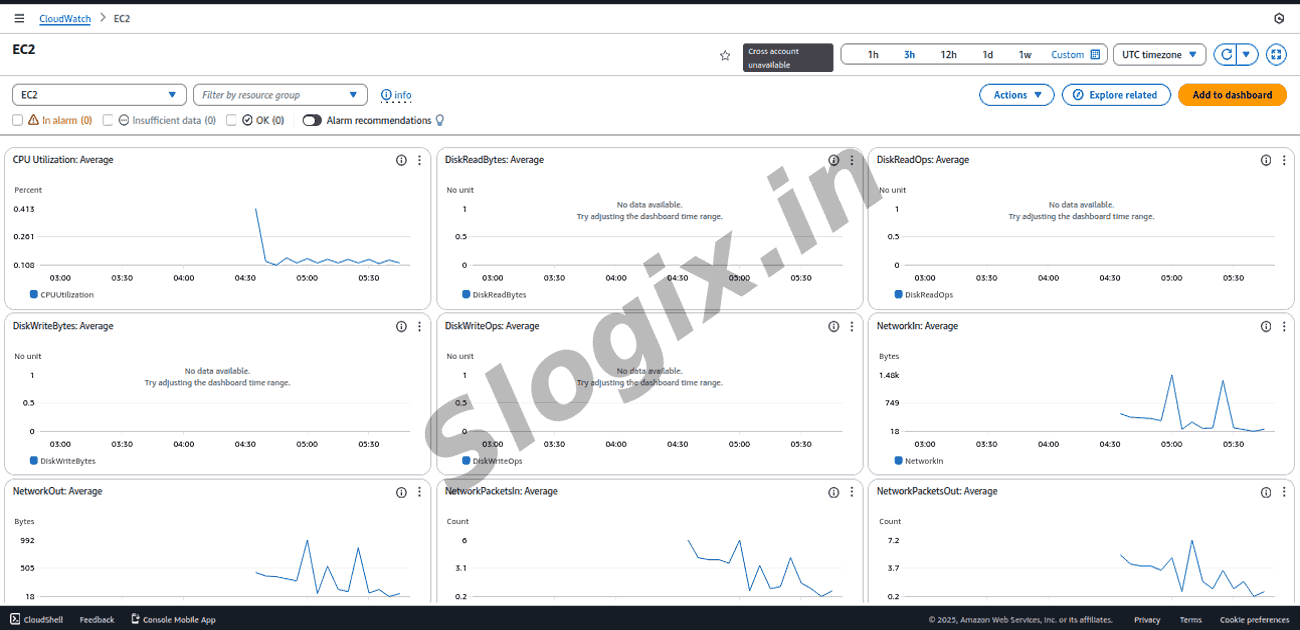
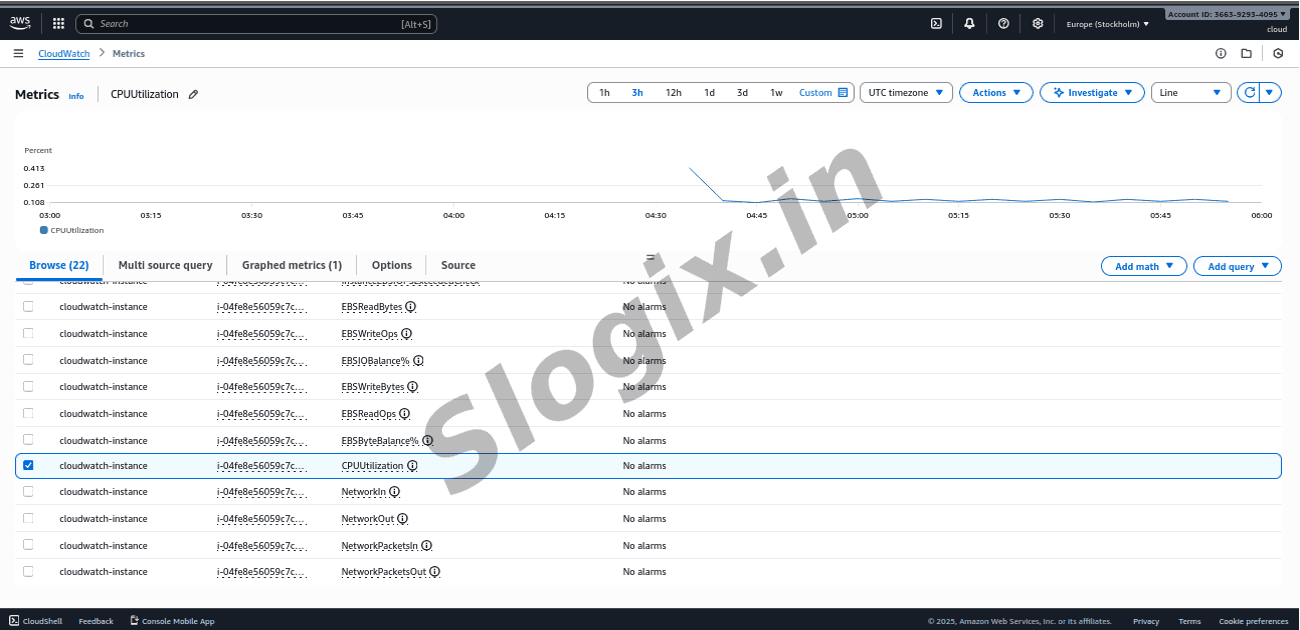
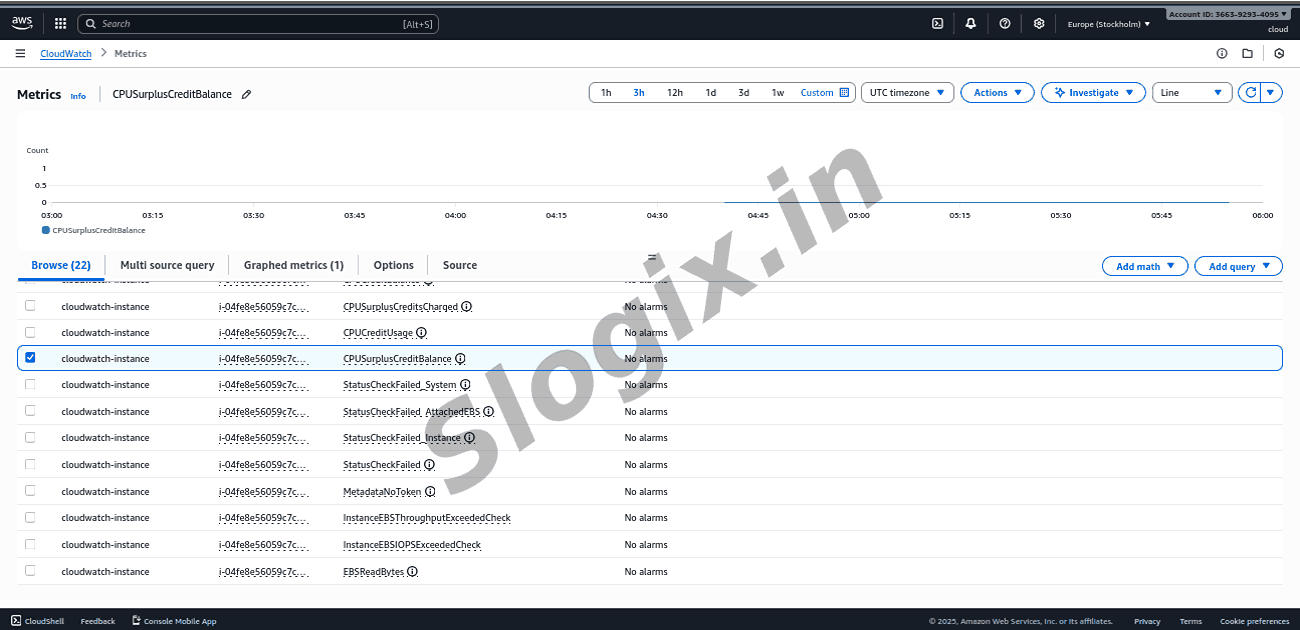
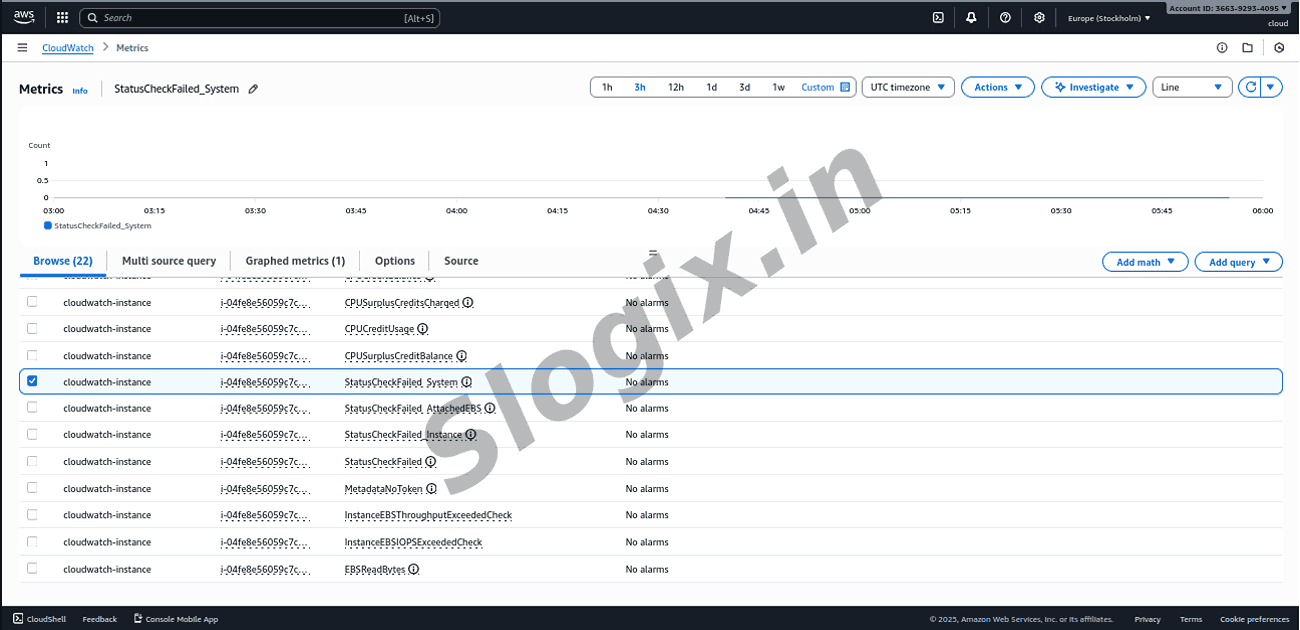
Step 5: View Key EC2 Metrics
Now see the visual graphs for:
CPUUtilization :
Measures CPU usage. Useful for performance tuning & scaling.
 Research Breakthrough Possible @S-Logix