-
Prelim — Fix common package issues (run only if installs fail)
Resume interrupted package configuration:
sudo dpkg --configure -a
Fix broken dependencies:
sudo apt install -f -y
Update package list afterwards:
sudo apt update
-
Step 1 — Install Node Exporter on the target server (example IP: 192.168.1.10)
Update packages:
sudo apt update
Install Node Exporter (APT package):
sudo apt install prometheus-node-exporter -y
Start and enable the service:
sudo systemctl start prometheus-node-exporter
sudo systemctl enable prometheus-node-exporter
Verify the service is running:
systemctl status prometheus-node-exporter
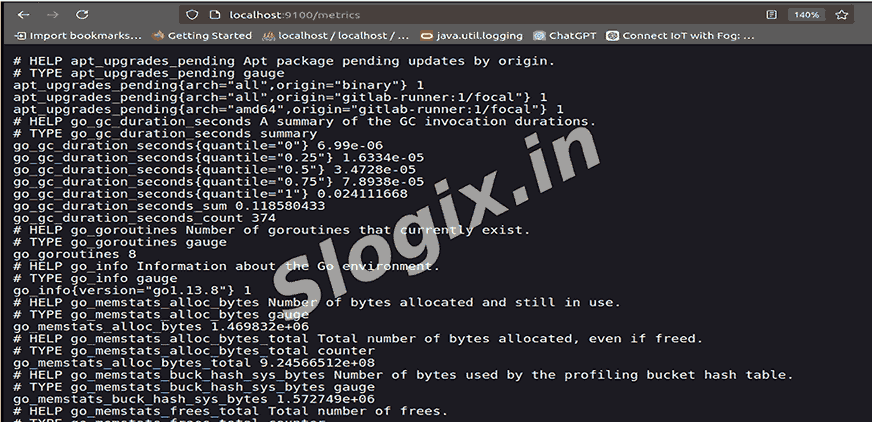
Confirm metrics are exposed:
curl http://localhost:9100/metrics | head
Expected: many metric lines including
node_cpu_seconds_total, node_memory_MemAvailable_bytes,
node_filesystem_avail_bytes.
Node Exporter endpoint:
http://192.168.1.10:9100/metrics
-
Step 2 — Install Prometheus on the monitoring server
Update packages:
sudo apt update
Install Prometheus:
sudo apt install prometheus -y
Start and enable Prometheus:
sudo systemctl start prometheus
sudo systemctl enable prometheus
Confirm service status:
systemctl status prometheus
Open Prometheus UI:
http://<prometheus-server-ip>:9090
(or http://localhost:9090 if local)
-
Step 3 — Configure Prometheus to scrape Node Exporter
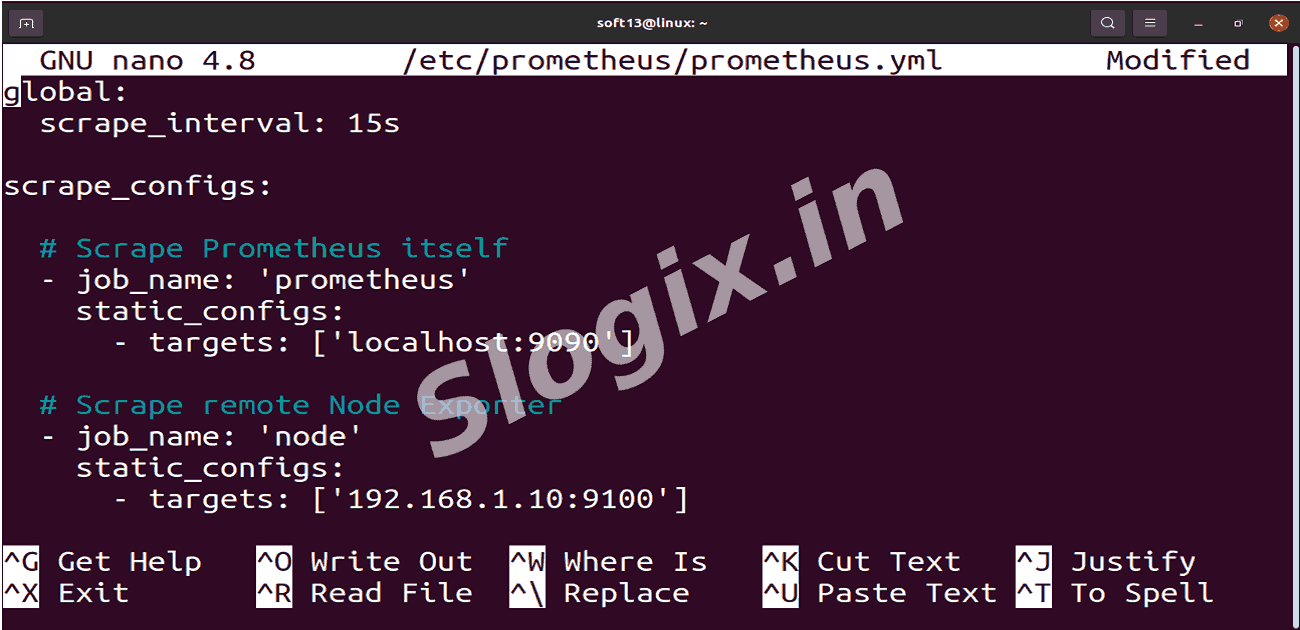
Edit Prometheus config:
sudo nano /etc/prometheus/prometheus.yml
Replace/add the following (adjust IPs if needed):
global:
  scrape_interval: 15s

scrape_configs:
  - job_name: 'prometheus'
    static_configs:
      - targets: ['localhost:9090']

  - job_name: 'node'
    static_configs:
      - targets: ['192.168.1.10:9100']
Save and restart Prometheus:
sudo systemctl restart prometheus
-
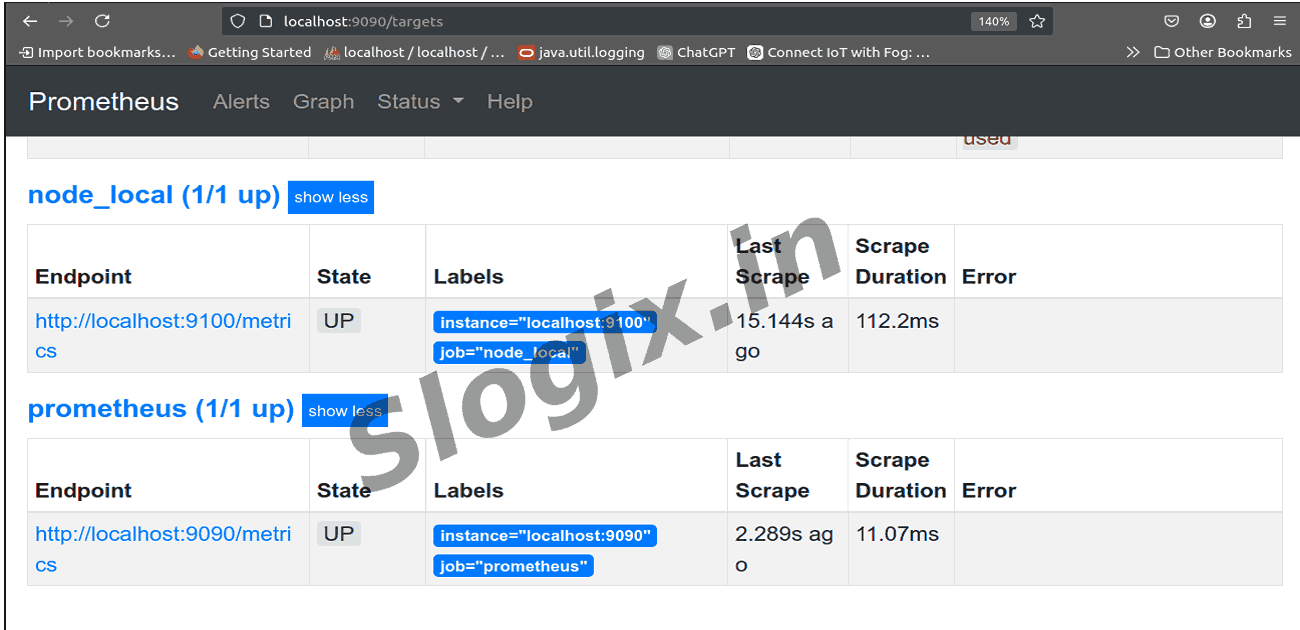
Step 4 — Verify Prometheus is scraping Node Exporter
Open targets page in browser:
http://<prometheus-server-ip>:9090/targets
Confirm you see
192.168.1.10:9100 with Status = UP.
If the target is DOWN, check on the target host:
sudo systemctl status prometheus-node-exporter
curl http://localhost:9100/metrics
From Prometheus host:
curl http://192.168.1.10:9100/metrics
Check firewall / network connectivity (allow port 9100).
-
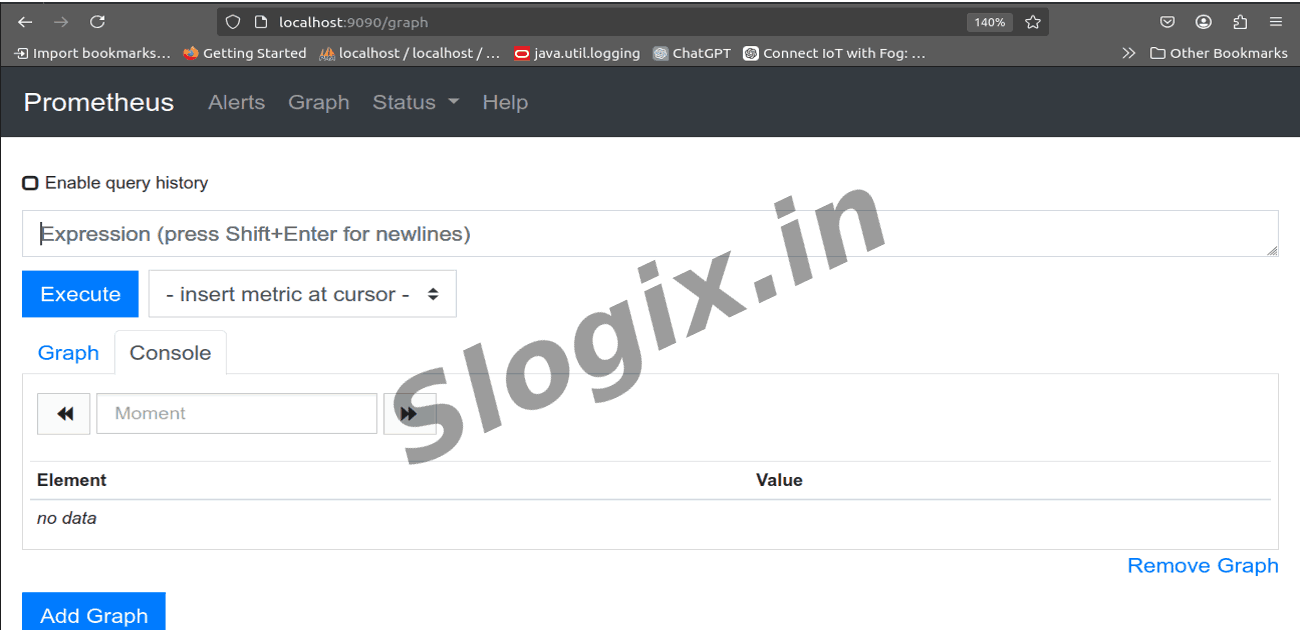
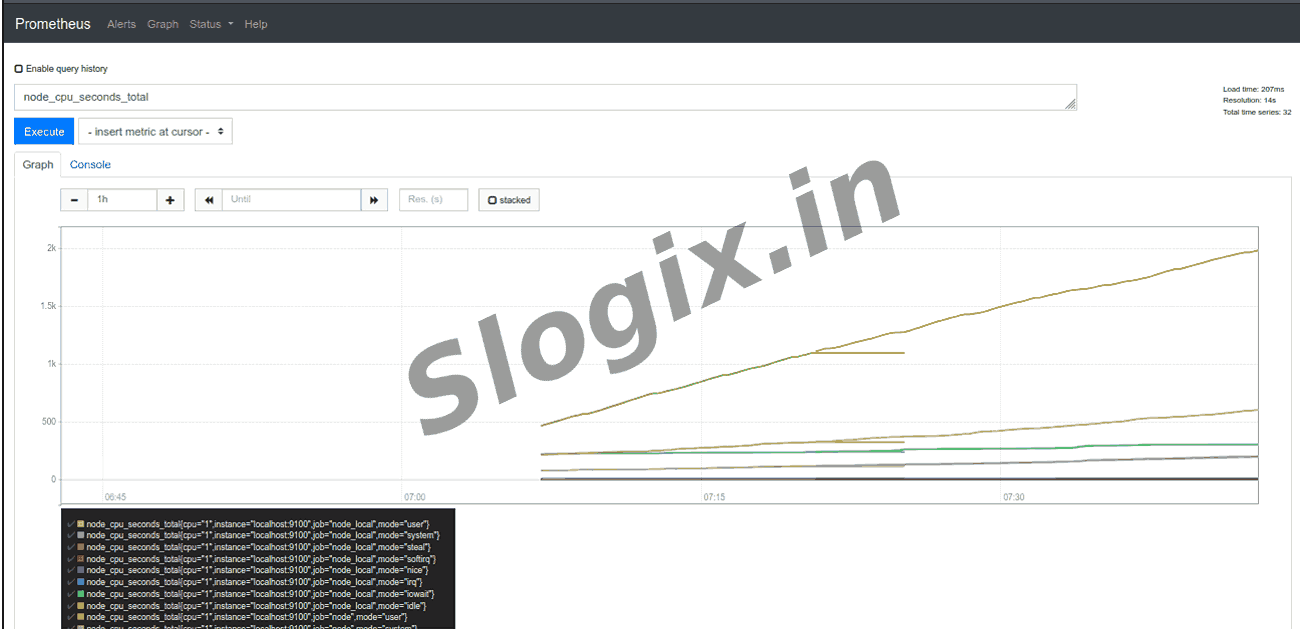
Step 5 — Run Prometheus queries (Graph tab)
Open Prometheus UI → Graph.
Run basic metric queries (paste → Execute):
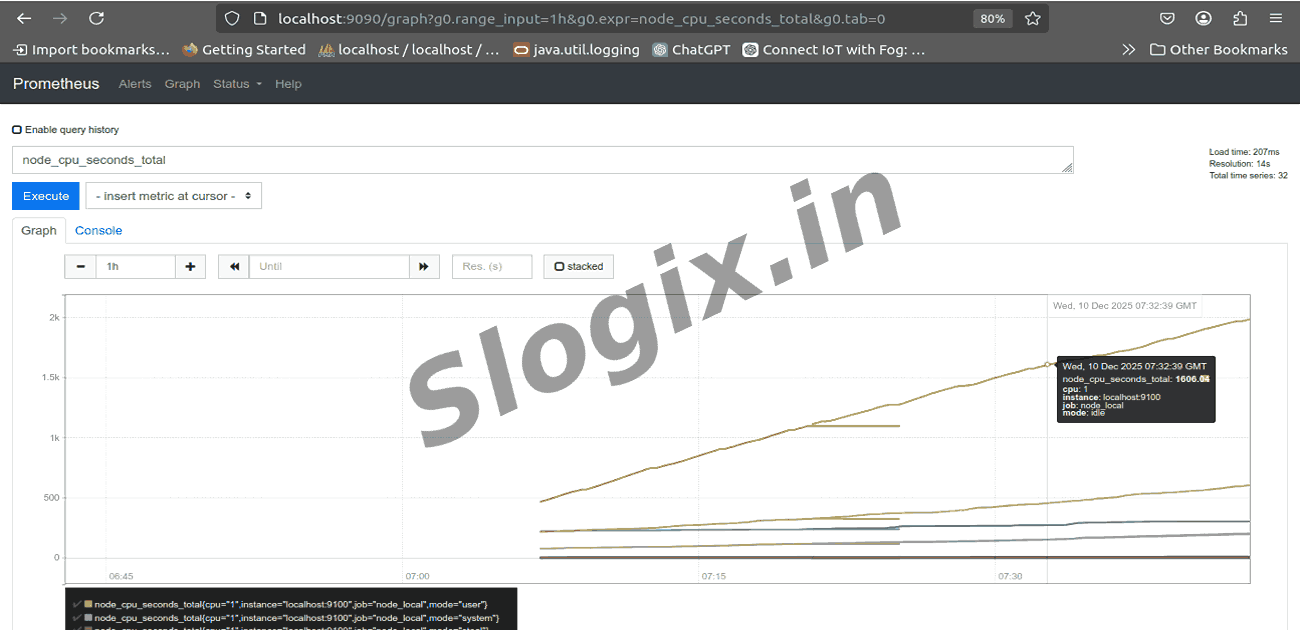
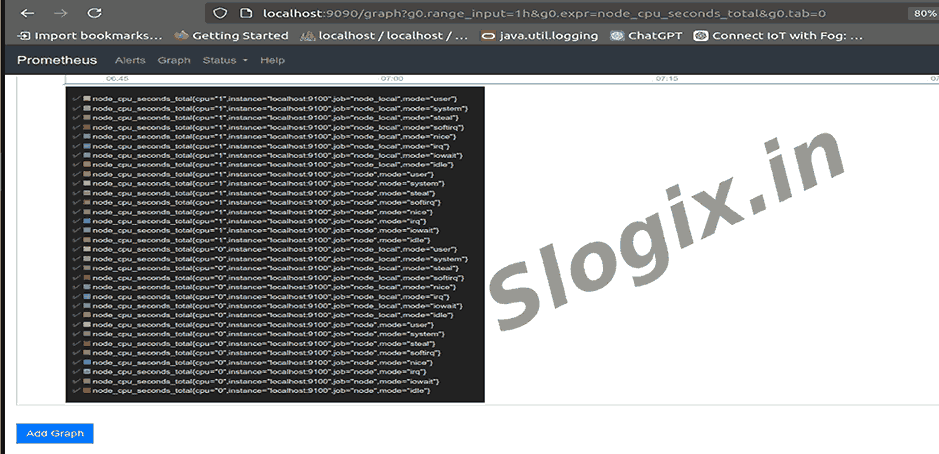
Raw CPU metric:
node_cpu_seconds_total
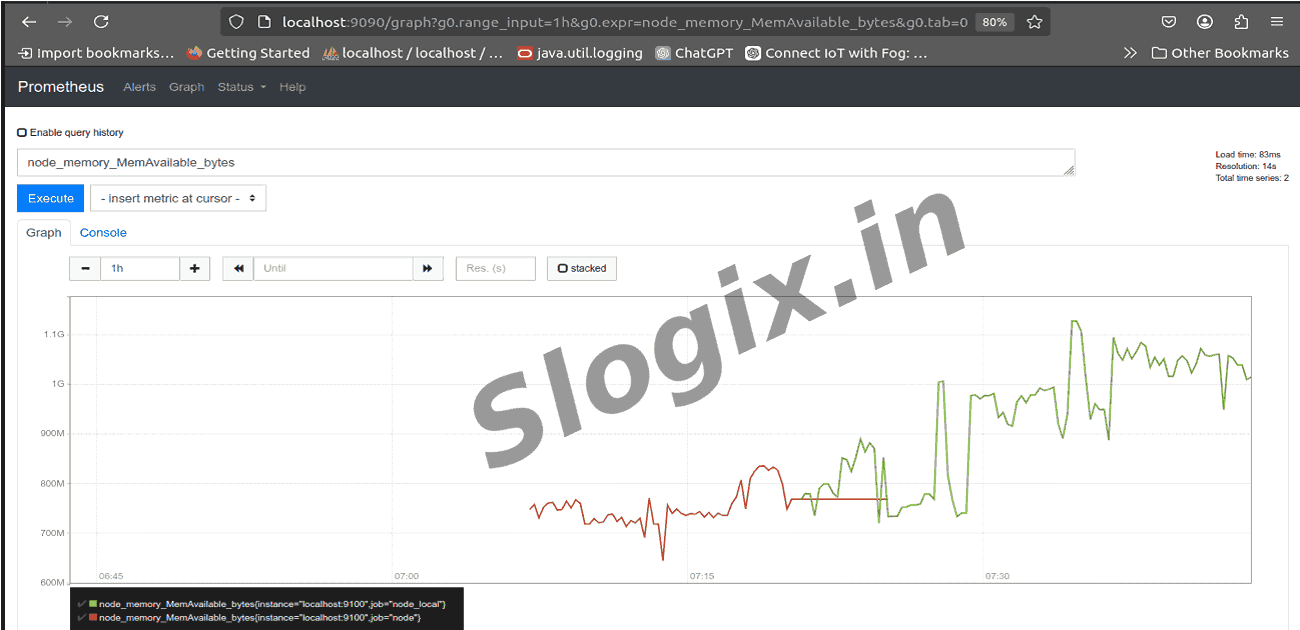
Available memory:
node_memory_MemAvailable_bytes
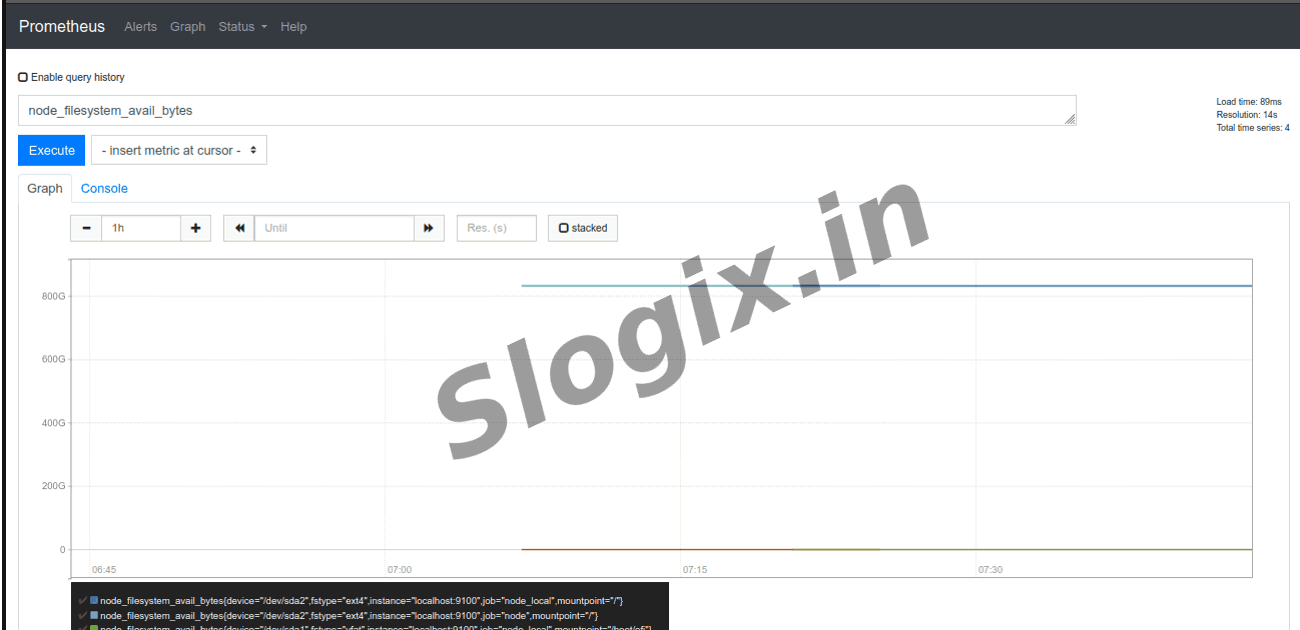
Available disk:
node_filesystem_avail_bytes
Run recommended derived queries (Execute → Graph):
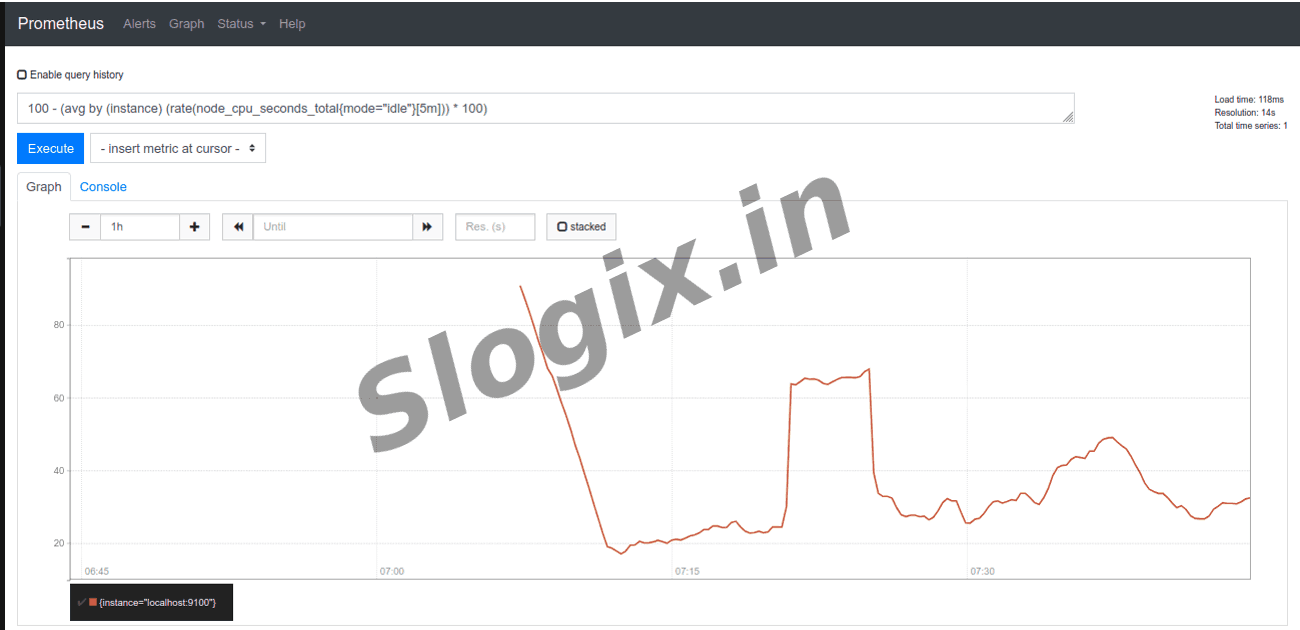
CPU usage %
100 - (avg by (instance) (rate(node_cpu_seconds_total{mode="idle"}[5m])) * 100)
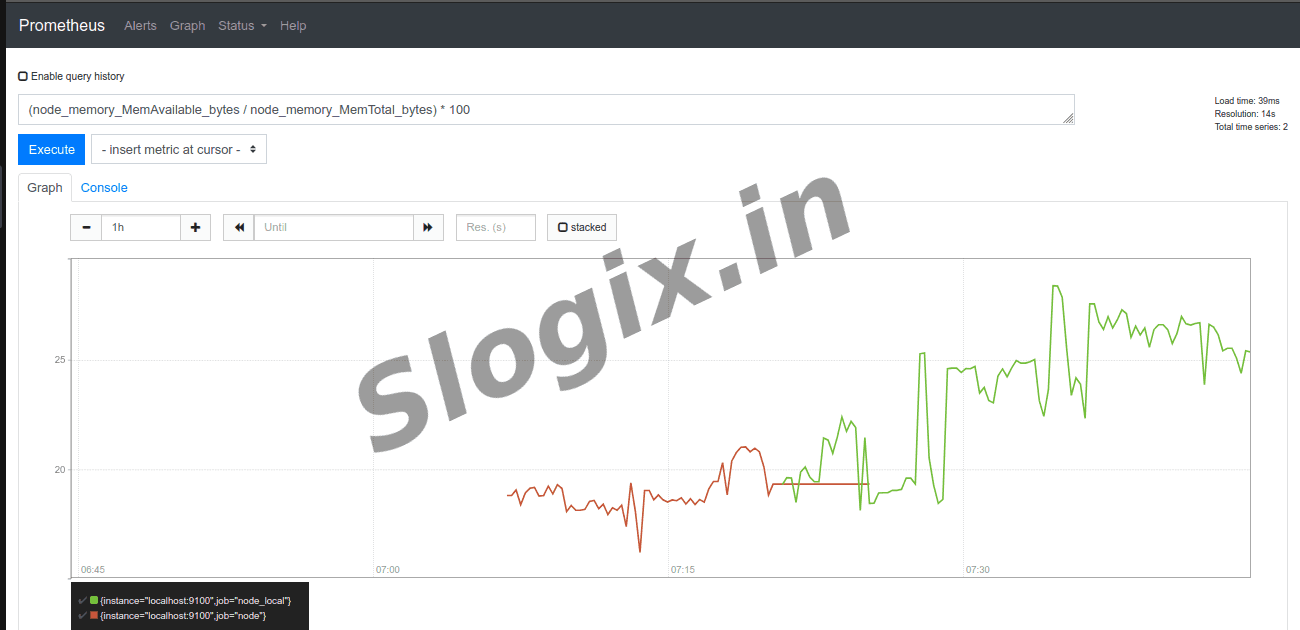
Memory available %
(node_memory_MemAvailable_bytes / node_memory_MemTotal_bytes) * 100
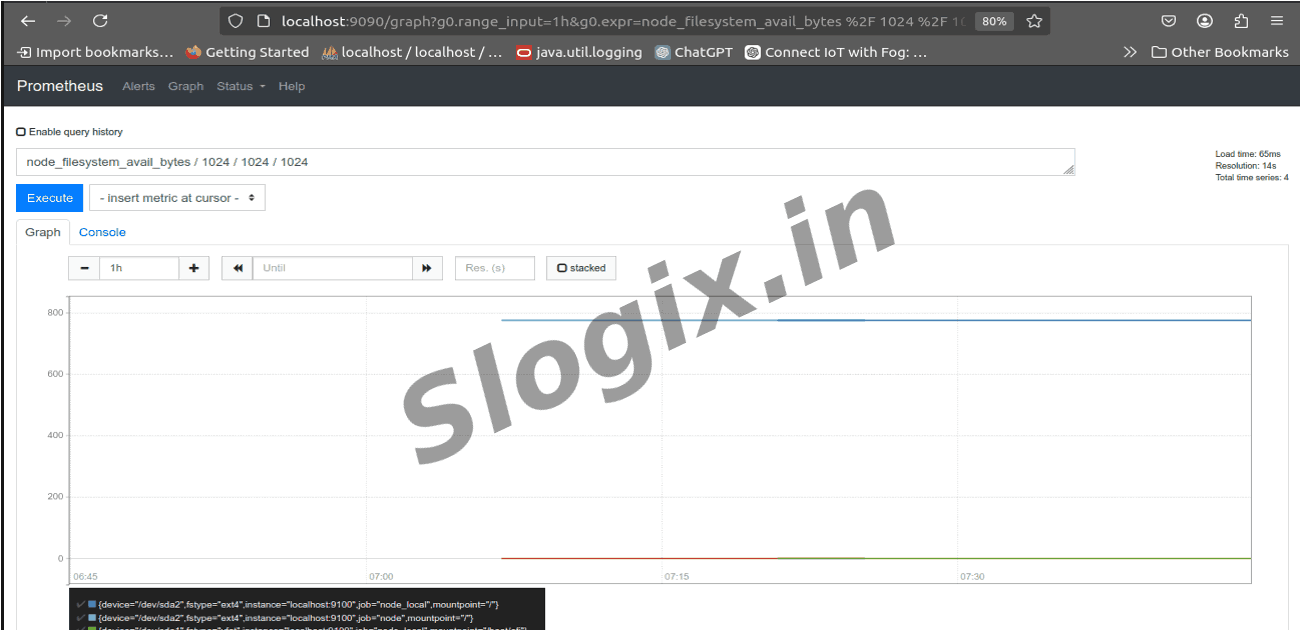
Disk available (GB)
node_filesystem_avail_bytes / 1024 / 1024 / 1024
 Research Breakthrough Possible @S-Logix