How to Check Whether the Residuals are Normally Distributed or Not Using Python?
Share
Condition for Residuals are Normally Distributed or Not
Description: In regression analysis, residuals (the difference between observed and predicted values) shouldideally be normally distributed, particularly for statistical inference (e.g., hypothesis testing, confidence intervals). Checking the normality of residuals is crucial to ensure the validity of the regression model's assumptions.In this guide, we will demonstrate how to test for normality using Python, including visualization techniques such as histograms, Q-Q plots, and statistical tests like the Shapiro-Wilk test.
Why Should We Choose This Method?
Histograms and Q-Q plots: Visual tools to assess how well the residuals align with a normal distribution. Easy to interpret and widely used.
Shapiro-Wilk test: A statistical test that provides a more objective measure of normality.
Heatmap: Useful for detecting patterns in residuals when you have multiple predictors and are concerned about multicollinearity or structure in residuals.These methods provide a comprehensive way of assessing the assumption of normality in residuals,ensuring the regression model’s reliability.
Step-by-Step Process
Fit a regression model on the dataset.Obtain residuals from the model (difference between actual and predicted values).
Statistical Tests for Normality: Perform the Shapiro-Wilk test for normality.Alternatively, use the Kolmogorov-Smirnov test or Anderson-Darling test.
Interpret Results: If the residuals are normally distributed, the model’s assumptions are likely valid.If not, you may need to transform the dependent variable or consider a different model
Sample Code
# Import necessary libraries
import numpy as np
import pandas as pd
import seaborn as sns
import matplotlib.pyplot as plt
import statsmodels.api as sm
from scipy import stats
from sklearn.linear_model import LinearRegression
# Generate synthetic data or use a real-world dataset
# Example: Generate synthetic data for demonstration
np.random.seed(42)
X = np.random.rand(100, 1)
y = 3 * X + np.random.normal(0, 0.5, size=(100, 1))
# Fit the linear regression model
model = LinearRegression()
model.fit(X, y)
# Get residuals
y_pred = model.predict(X)
residuals = y - y_pred
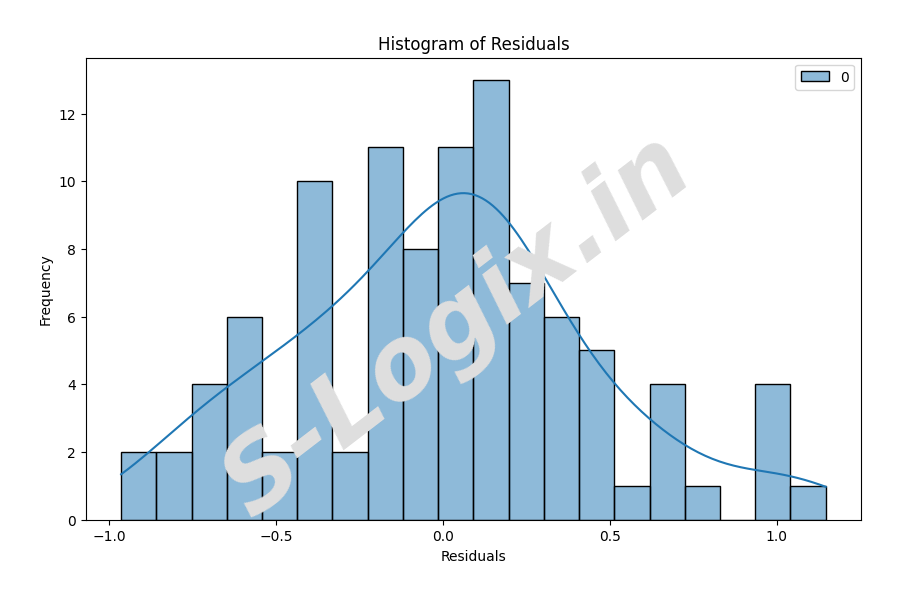
# Visualizations: Histogram of Residuals
plt.figure(figsize=(10, 6))
sns.histplot(residuals, kde=True, bins=20, color='skyblue')
plt.title('Histogram of Residuals')
plt.xlabel('Residuals')
plt.ylabel('Frequency')
plt.show()
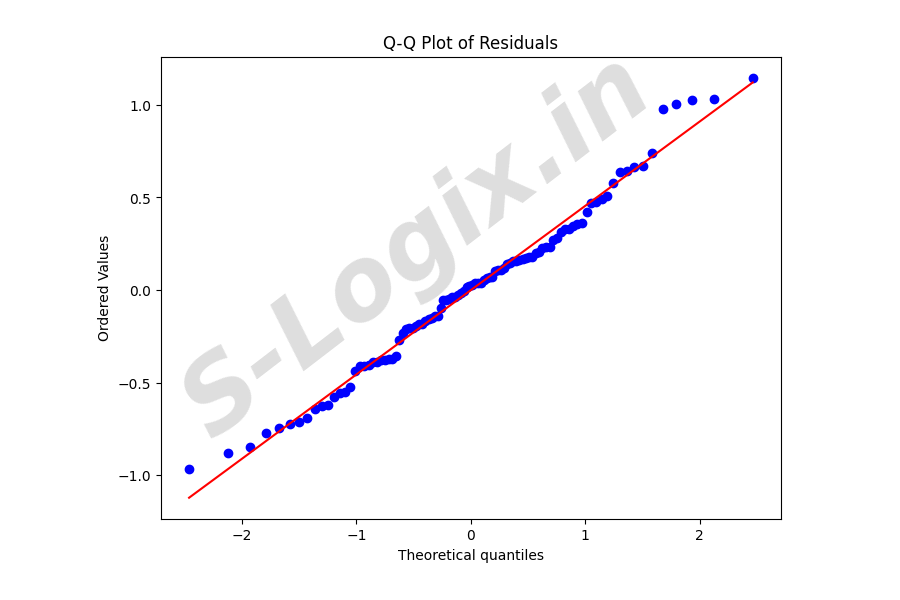
# Q-Q Plot
plt.figure(figsize=(8, 6))
stats.probplot(residuals.flatten(), dist="norm", plot=plt)
plt.title('Q-Q Plot of Residuals')
plt.show()
# Shapiro-Wilk Test for Normality
stat, p_value = stats.shapiro(residuals.flatten())
print(f"Shapiro-Wilk Test: Statistics={stat:.4f}, p-value={p_value:.4f}")
# Conclusion
if p_value > 0.05:
print("Residuals are normally distributed (fail to reject H0).")
else:
print("Residuals are not normally distributed (reject H0).")
 Research Breakthrough Possible @S-Logix